Download

1 / 71
820 likes | 1.24k Views
SCM 330 Ocean Discovery through Technology. Area F GE. Chemical Oceanography. Chemistry of Seawater. Why is Ocean Chemistry Important?. Chemical Oceanography. Composition in atmosphere rarely changes from average because the mixing time is short

E N D
SCM 330 Ocean Discovery through Technology Area F GE
Chemical Oceanography Chemistry of Seawater
Why is Ocean Chemistry Important? Chemical Oceanography • Composition in atmosphere rarely changes from average because the mixing time is short • Water has a much higher viscosity, and mixing time is greater, so chemical elements and compounds can change in concentration with location • Many of these elements and compounds affect ocean life • Some affect global climate
Water is a Universal Solvent Chemical Oceanography Polarized water molecule tears apart atoms in lattices glued by ionic or electrostatic bonds Forms hydration spheres around ions, keeping them from rebinding
Salinity of Seawater Chemical Oceanography Salinity of seawater defined as amount of dissolved solids Normal is 35 %o (parts per thousand) or 35 g in 1000 g of water Evaporate water 1000 grams of seawater 35 grams of salts
Constituents of Ocean Salt Chemical Oceanography 96.5% water Constancy of composition: with very small error, major salt components occur in the same ratio throughout the ocean This means if we measure the amount of one salt, we can calculate the others from known ratios
Six Major Elements Chemical Oceanography Six major elements make up 99% of salts Chloride Sodium Sulfate Magnesium Calcium Potassium
Seawater Density Chemical Oceanography Density increase Density decrease Water has unusual property of expanding when it freezes It contracts and becomes denser as it cools, as do most substances Reaches maximum density at 3.98° C and then expands Expansion caused by crystal lattice formation Near 0°C water expands abruptly and density drops to 0.917 g/cm3 So ice is less dense than water and floats
Density Behavior Chemical Oceanography • Large water bodies do not freeze solid • Example: Fresh water lake • Cooling at the surface • Dense surface water sinks • Overturning of lake until 4oC • THEN the lake surface freezes • If ice more dense than water… • Ice would sink, • Entire lake would freeze solid!
Salinity Changes Freezing Point Chemical Oceanography Adding salt reduces freezing temperature by inhibiting the formation of ice lattice Temp of Freezing Temp of Max. Density Then… Salinity • Most seawater never gets cold enough to freeze -1.5oC !! • High heat capacity • Ocean currents
In Situ Density Chemical Oceanography • In Situ Density • Sigma () is the density of water in place in the ocean at whatever depth it is found • Pressure (depth) causes a slight increase in density • Usually expressed only by the last four digits and usually • without units • It is converted to Specific Gravity by dividing by the density of • pure water, then subtracting 1, and multiplying by 1000 • 1.02493 g/cm3 = 24.93 • is primarily a function of salinity and temperature
How is Density Determined? Chemical Oceanography • Calculated from… • Temperature • Salinity • Pressure Equation of state for seawater density effect of pressure removed (increases temp) Potential density In situ density effect of pressure NOT removed
T-S Diagram Chemical Oceanography Decrease in temp Increase in density Lines of constant density Calculated from seawater state equation Different water masses can be identified by s
Average Density Changes with Latitude Chemical Oceanography Highest temperature at equator Highest salinity in tropics owing to evaporation Lowest density at the equator caused by precipitation **Temperature has strongest control of density changes
Pycnocline Chemical Oceanography Rapid density change with depth Stable barrier to mixing Strong pycnocline – tropics Weak pycnocline – high latitudes
Pycnocline Related to Halocline and Thermocline Chemical Oceanography Halocline - rapid change in salinity with depth Thermocline - rapid change in temperature with depth
Dissolved Gasses Chemical Oceanography • Gas content (solubility) in water depends on… • Pressure • Temperature • Escape to atmosphere • Temperature most important factor • Interchange with atmosphere depends on wind and waves • CO2 ten times higher solubility
Conservative & Non-conservative Gas Chemical Oceanography • Two classes of gases in the atmosphere • Conservative – unreactive in the ocean • Tracers of water mass movements • N, Ar, noble gases (trace) • Non-conservative – altered in the ocean • Used to asses Photosynthesis, respiration • CO2, O2
Gas vs. Depth Profiles Chemical Oceanography O2 shows a minimum at ~1000 m depth Respiration uses O2 in shallow waters Deep waters come from polar regions where respiration not as high, so they have higher O2 Low O2 concentration can limit life at shallow depths, especially where high productivity causes ver low concentration (hypoxia) Note Pacific water has less O2 because it has been out of contact with atmosphere longer Note CO2 profile is mirror image of O2 profile
Carbonic Acid System Chemical Oceanography Carbonic acid combines with CO2 to make carbonate Seawater buffers CO2 in atmosphere pH of Ocean is 7.5-8.4
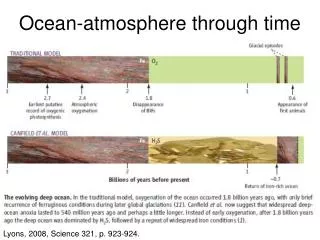
Biogeochemical Cycles Chemical Oceanography Cycling of important organic compounds in water and earth Important cycles: nitrogen, carbon, sulfur, oxygen
Carbon Cycle Chemical Oceanography
Nitrogen Cycle Chemical Oceanography
Phosphorus Cycle Chemical Oceanography
Geological Oceanography Global Plate Tectonics • The Earth’s surface is not static (it’s moving) • It’s all about the heat (convection) • The Earth is moving under your feet • TOPICS • Structure of the Earth • Isostasy • Plates • names and motions • Boundaries • convergent • divergent • transform fault • processes at each boundary • Sea Floor Spreading • mechanism • convection • rates of spreading
Crust and Lithosphere Geological Oceanography Thurman and Burton Why are the oceans lower and continents higher? It’s about density and buoyancy Continental crust = 2.7 g/cm3 Oceanic crust = 3.0 g/cm3 Mantle = 3.3 g/cm3 • Isostasy is the concept that the crust “floats” on the mantle and height is related to density and thickness
Geological Oceanography Isostatic Equilibrium h Mass of water displaced equals mass of ice ri ri• L = rw • H = ri • (h + H) H L rw • h = H • (rw - ri)/ri • or H = (ri/rw) • L What about an iceberg? ri = 917 kg/m3rw = 1025 kg/m3 L = 1000 m So H = (1025/917) • L = 0.89 *1000 = 890 m 89% of iceberg is below water
Geological Oceanography Isostatic Equilibrium for the Crust Average ocean depth = 4 km Mountain height = 4.5 km so crust height = 8.5 km Oceanic crust = 6km How deep must the continent be? H = (ri • h)/(rw-ri) Answer: H = (8500 • 2700)/(3300-2700) = 38250 m = 38.3 km Continent = 8.5 + 6 + 38.3 = 52.8 km
Geological Oceanography Plate Tectonics is Accepted • After WWII data accumulated rapidly from the oceans • Paleomagnetic data (ancient magnetic poles) indicated that continents had moved over millions of years • Magnetic anomalies (stripes) in the oceans showed that new seafloor was created at mid-ocean ridges (seafloor spreading) • Earthquake locations showed that plates were descending into mantle at ocean trenches • Still controversial in 1964, “global plate tectonics” was accepted theory by 1969
Geological Oceanography Breakup of Pangea
Geological Oceanography Early Evidence for Continental Drift • Matching size and shape of coastline of • Africa and South America • The fossil record - evidence of similar • species assemblages • Paleogeographic and Paleoclimatic • similarities • Dating - similar ages of crust and fossils • Paleomagnetism - the orientation of • magnetic fields within rocks compared • to Earth’s present-day and ancient • magnetic field orientation Sir Edward Bullard’s Fit of the Continents (1965) at a water depth of 137 m (450 ft)
Geological Oceanography Evidence from Paleomagnetism • Some rocks record the magnetic field direction at the time they form • Basalts are good • Some sediments work too • The Earth’s magnetic field has the shape of a giant bar magnet • Field lines point down in the northern hemisphere and up in the southern • Dip of magnetic field is proportional to latitude • Geologist takes an oriented rock sample and measures the direction with a magnetometer Magnetic field looks like bar magnet
Geological Oceanography Seafloor Spreading • Fred Vine and Drummond Matthews theorized that the magnetic stripes were caused by recording of zones of opposite polarity along the ridge axis • Hot magma rises at the ridge axis, as it cools it acquires the prevailing magnetic polarity • Seafloor spreading pulls the plates apart, so that new magma upwells into the crack and forms new lithosphere • With time, magnetic field reverses and makes a new stripe • Stripes are symmetric around ridge axis
Geomagnetic Polarity Time Scale Extended Geological Oceanography Using magnetic anomalies from the oceans, scientists have extended the GPTS back to 150 Myr Black zones in column are normal, white are reversed Note Cretaceous Long Normal
Geological Oceanography Magnetic anomaly pattern shows that lithosphere is youngest at mid-ocean ridges and increases in age with distance
Geological Oceanography Earthquakes Occur at Plate Boundaries
Geological Oceanography Earthquakes Show Plates Decending into Mantle Earthquake locations plotted as dots in plane perpendicular to Tonga Trench Earthquakes occur along dipping plate as it moves into mantle Plate is eventually heated and absorbed into mantle
Geological Oceanography Direction of Plate Movement/Boundary Type
Geological Oceanography • Plate edges can do one of three things: • Move apart (diverge) Divergent (constructive) boundary • 2. Come together (converge) • Convergent (destructive) boundary • 3. Slide past one another • Conservative (shear, transform) boundary
Divergent Boundary Geological Oceanography Plates are pulled apart Decompression causes upper mantle melting Melt forms magma chamber and rises to fill crack between plates (dikes) and erupt on surface (pillow lavas) Magma and lavas create new lithosphere Process called seafloor spreading
Mid-Ocean Ridges Geological Oceanography Longest mountain range on Earth Total length ~40,000 km
Geological Oceanography Dynamics of Different Plate Boundaries
Hotspots Geological Oceanography As plate moves over mantle, a linear seamount chain is formed Hawaiian Islands are classic example Some volcanoes don’t occur in the middle of plates, not at boundaries Source may be thermal plume of hot material that rises through mantle Erupts as a volcano when it arrives at litho-sphere
Geological Oceanography Formation of the Hawaiian Islands Loihi seamount, Hawaii
Geological Oceanography Atolls • Charles Darwin (1842) proposed a mechanism for the formation of coral atolls • Wasn’t verified until nearly 100 years later when deep drilling revealed basalt which indicates an underlying seamount • Coral reefs can be characterized as fringing, barrier, or atoll based on stage of development