Oracle SGA Memory Management
860 likes | 1.72k Views
Oracle SGA Memory Management. Tirthankar Lahiri Senior Manager Distributed Cache and Memory Management Oracle Corporation. Outline. Architecture of the Oracle Buffer Cache Automatic SGA Memory Management. Architecture of the Oracle Buffer Cache. Overview Basic buffer cache structure

Oracle SGA Memory Management
E N D
Presentation Transcript
Oracle SGA Memory Management Tirthankar Lahiri Senior Manager Distributed Cache and Memory Management Oracle Corporation
Outline • Architecture of the Oracle Buffer Cache • Automatic SGA Memory Management
Architecture of the Oracle Buffer Cache • Overview • Basic buffer cache structure • Multiple buffer pools • Multiple block size support • Configuring the buffer cache • Diagnosing common performance issues • New 10g functionality
Overview of Buffer Cache • Shared cluster-coherent cache of disk data • Uniform data access interface for the RDBMS • Usually constitutes the bulk of the SGA • Proprietary LRU-based replacement policy • Multiple partitions (working sets) for concurrency • Multiple writer processes for throughput • Novel incremental checkpointing mechanism
Basic Buffer Cache Structure Buffer Hash Table • Buffer Hash Table: Lookup table for locating buffers in the cache • Number of hash buckets = 2 x #buffers • Hash buckets are protected by hash latch (name in v$latch is “cache buffers chains”) • Multiple hash buckets protected by a single latch to save memory • Number of latches = #buffers / 128
Basic Buffer Cache StructureBuffer Hash Table Hash Buckets Buffer Hash Chains • Hash function converts DBA to hash index or bucket • Clones of a buffer hash to same chain • Concurrent access to buffers under different latches CR Clones Hash Latches
Basic Buffer Cache StructureWorking Sets • Cache is partitioned into multiple “working sets” • Sets act as independent cache partitions • Each buffer is statically assigned to a working set • A working set consists of: • LRU replacement list • Buffer Checkpoint Queue • Working set is protected by two latches • “cache buffer lru chains” latch • “checkpoint queue” latch • DB_BLOCK_LRU_LATCHES obsolete from 9i, we internally pick an appropriate value based on the number of cpus, whether on NUMA machine, etc.
Basic Buffer Cache StructureLRU replacement Lists LRU replacement lists • On a cache miss a user process picks a random working set • Replaces the coldest buffer in that set with the copy read from disk • Replacement policy is designed to minimize list manipulations • Near optimal hit-rate in cache LRU latches
Basic Buffer Cache StructureLRU replacement Lists Hot buffers • DBWR writes from the cold end • Create clean buffers that can be used for replacement DBWRITER writes from cold end of LRU list Cold buffers
Basic Buffer Cache StructureBuffer Checkpoint Queue • Redo Thread is the set of logfiles for an instance • Conceptually: ever-growing sequence of changes • Indexed by RBA (Redo Byte Address) • Special RBAs: • Thread Checkpoint: Recovery starts here • Tail of Log: RBA of last change in redo thread Checkpoint “Lag” Thread Checkpoint • Tail of Log
Buffers b1 b2 b3 b4 Redo Thread c0 c1 c2 c3 c4 (Thread Checkpoint) Basic Buffer Cache StructureBuffer Checkpoint Queue • Buffer Checkpoint Queue (BCQ) • Ordered by RBA of first change (first-dirty or low RBA) • Buffer is linked into BCQ when first dirtied • Writes in BCQ order advance thread checkpoint
(Write b1) c0 c1 c2 c3 c4 c1 c2 c2 c3 c4 (Write b2) b4 (Write b3) c3 c4 c3 c4 Basic Buffer Cache StructureBuffer Checkpoint Queue Each write in BCQ order advances the checkpoint b1 b2 b3 b4 b2 b3 b4 b3 b4
Basic Buffer Cache StructureBuffer Checkpoint Queues • Multiple BCQs for high-concurrency • Buffers within a working set are assigned the same BCQ • Lowest low-RBA of all BCQs determines thread checkpoint • CKPT periodically updates controlfile with this RBA Buffer Checkpoint Queues Checkpoint Queue Latches
Multiple Buffer Pools • Working sets can be divided between “buffer pools” • Primary (DEFAULT) pool always exists • Parameter governing size is DB_CACHE_SIZE • Optional KEEP cache: for frequently accessed objects that should be kept in memory • Optional RECYCLE cache: for objects with very little locality that should be purged • Parameters: • DB_RECYCLE_CACHE_SIZE • DB_KEEP_CACHE_SIZE • Buffer Pools are useful for simple schemas • Not recommended for Oracle Apps: 60,000 + objects.
Multiple Blocksizes • Allows buffer caches for blocksizes other than standard blocksize (DB_BLOCK_SIZE) • Parameters: DB_<N>K_CACHE_SIZE {N=2,4,8,16,32} • BLOCKSIZE attribute in CREATE TABLESPACE storage clause • Intended for transportable tablespaces • Not intended as a performance feature • Management overhead does not justify the small performance gains (if any)
Multiple Buffer Pools and Multiple Blocksize Caches • Within a buffer pool working sets are of the same size • Objects assigned to different buffer pools do not interfere with one another in the cache DEFAULT 16k CACHE KEEP RECYCLE Set #8 Set #7 Set #4 Set #1 Set #2 Set #1 Set #3 Set #6 Set #5
Dbwriter (DBWn) process • The database writer is responsible for cleaning the buffer cache: • Writes buffers to allow buffer replacement • Writes buffers to advance the thread checkpoint • Do forever { Scan lru list; Scan checkpoint queue; Accumulate batch of buffers to write; Issue writes (using most efficient OS mechanism available); Wait for completion of writes; }
Multiple Database Writers Set 0 Set 1 Set 2 Set 3 • A mechanism for increasing write throughput • Buffer cache is partitioned between dbwriters by working sets • Each DBWn process scans its own assigned working sets DBW1 DBW0 Writes to Datafiles
Multiple IO Slaves Set 0 Set 1 Set 2 Set 3 • IO slaves allow a single dbwriter to issue writes in parallel • Dbwriter gathers a batch of buffers to write. • Queues the buffers in round-robin order with the IO slaves • Waits for the slaves to complete all the writes • NOTE: Cannot have multiple dbwriters AND dbwr IO slaves DBW0 i003 i004 i002 i000 Writes to Datafiles
Configuring Buffer Cache • Configuring buffer cache size • Configuring multiple writer processes • Configuring checkpointing
Configuring Buffer Cache Size • Parameter for buffer cache size: DB_CACHE_SIZE • This is preferred to the old DB_BLOCK_BUFFERS parameter • Includes all memory for the buffer cache including metadata (buffer headers) • This parameter is required for new buffer cache functionality • Dynamic grow/shrink • Buffer cache size advice • Multiple blocksizes • DB_BLOCK_BUFFERS should be set only with VLM (extended memory on 32 bit systems)
Buffer Cache Size Advisory • Performs online simulation of the workload for different cache sizes • Very low overhead (<0.1%) in terms of cpu and memory usage • Predicts change in I/Os as the buffer cache size is changed from 10% to 200% of the current size • Simulation Results (for all buffer pools) published in V$DB_CACHE_ADVICE • On by default in 9.2 and 10gR1; can be turned off using STATISTICS_LEVEL parameter
Configuring Multiple Writers • For most systems 1 database writer is enough • A dbwriter concurrently issues upto 4k writes in parallel • Reasons to consider multiple IO slaves: • Async IO is not supported and a single dbwriter would have to issue successive synchronous writes. • Reasons to consider multiple dbwriters include high wait times for: • Free buffer waits (cache not being cleaned fast enough) • Logfile switch: checkpoint incomplete (checkpoint not advanced out of previous log, blocking redo generation) • Also consider multiple dbwriters if a single dbwriter consumes 100% of a cpu.
When are Multiple Writers Really Needed? • An important myth to dispell: • “Write throughput is always critical for performance” • Many DBAs will configure large numbers of dbwriters or IO slaves even though this is unnecessary for performance • Writes are a background activity • A user process normally never waits for dbwriter • If there are negligible wait times on “free buffer wait” and “log file switch” more dbwriters or IO slaves will not help performance
When are Multiple Writers Really Really Needed? • Another myth to dispell: • “Multiple dbwriters will help me get more bandwidth out of my IO subsystem” • Free buffer waits due to slow writes to saturated disks will not go away with multiple dbwriters or IO slaves • A good indication is the time spent on “db file sequential read” (foreground reads). • If this time is high the bottleneck is the disk, not the number of dbwriters.
Configuring Checkpointing • Recovery time composed of two factors: • Redo Log I/O: Large sequential reads • Data Block I/O: Small random reads & writes • Incremental (fast-start) checkpointing: • Writes are trickled out from the BCQs in RBA order • Avoids I/O bursts (as with normal checkpointing) • Minimal impact on normal throughput
Configuring CheckpointingCheckpointing Parameters • There are multiple checkpointing parameters • FAST_START_IO_TARGET • LOG_CHECKPOINT_INTERVAL/TIMEOUT • New preferred parameter in Oracle 9i: • FAST_START_MTTR_TARGET • Specifies MTTR (mean time to recover) • Database Writer computes a target RBA “T” • Tredo: Time to apply redo from T to tail of log • Tdata: Time to read and write buffers on BCQ with low RBA > T • Tredo + Tdata <= FAST_START_MTTR_TARGET
Configuring CheckpointingFAST_START_MTTR_TARGET in action #buffers = 1050 BCQ #redo blocks = 2350 T c0 (Target RBA) (Thread Checkpoint) FAST_START_MTTR_TARGET = 140 seconds Tredo = Time to read and apply 2350 blocks of redo = 10 seconds Tdata = Time to read and write 1050 data blocks = 125 seconds Tredo + Tdata <= FAST_START_MTTR_TARGET
MTTR parameter value Estimated physical writes 20159 150s 100s 21125 50s 22096 Configuring Checkpointing • In 9iR2: V$MTTR_TARGET_ADVICE predicts the impact of changing the value of FAST_START_MTTR_TARGET
Configuring CheckpointingImpact of Logfile Size • Max checkpoint lag = 90% of smallest logfile • Designed to prevent logswitch from blocking • A small logfile can result in excess checkpoint writes Current tail Logfile #1: 10000 blocks 9000 blocks Logfile #2: 10000 blocks Target Checkpoint
Configuring CheckpointingImpact of Logfile Size • New in 10g: Logfile Size Advice • Computes the optimal logfile size for the instance • This size of logfile will produce no additional checkpoint writes beyond those caused by FAST_START_MTTR_TARGET parameter • This optimal size of logfile is published in V$INSTANCE_RECOVERY
Configuring CheckpointingDetermining Extra I/Os Caused by Checkpointing • Examine the following system statistics • “physical writes”: total number of blocks written • “physical writes non checkpoint”: theoretical number of blocks that would have been written in the absence of checkpointing • The difference between the two values tells you how many extra writes checkpointing caused
Performance Issues • Two sporadic performance issues that can usually be traced back to the application or configuration: • Contention on “cache buffers chains” latch • High wait time for “buffer busy waits” • Other common issues: • High wait time for “db file sequential read” • High wait time for “free buffer waits”
Performance IssuesHash Latch Contention • Usually one or more hot blocks under the same latch, worse with larger blocksizes (16k, 32k) • To find the blocks contributing to this contention: • Determine the hash latches with the highest number of sleeps from v$latch_children • Determine the buffers they protect from x$bh: the fixed table on buffer headers (join the addr column in v$latch_children with the hladdr column in x$bh) • Look for buffers with high touch counts (tch column).
Performance IssuesHash Latch Contention SQL> select name, addr, sleeps from v$latch_children where name like 'cache buffers%' and sleeps > 100000; NAME ADDR SLEEPS ----------------------------------- -------- ---------- cache buffers chains 8D7B3F8C 128056 SQL> select obj,tch, file#, dbablk from x$bh where hladdr = hextoraw('8D7B3F8C’) order by tch asc; OBJ TCH FILE# DBABLK ---------- ------- ---------- ---------- 25259 19 21 242597 26023 46 12 893243
Performance IssuesHash Latch Contention • If possible: restart instance with a different value of hash buckets and hash latches, for example: • _DB_BLOCK_HASH_LATCHES = 2 x present number • _DB_BLOCK_HASH_BUCKETS = 1.5x present number • The hot buffers will now move to a different set of buckets and latches • The hot buffers that you find in both cases (the intersection of the two sets) are the likely culprits • We are working on automating this determination of hot buffers in a future release
Performance IssuesHigh Wait Time for “Buffer Busy Waits” • Buffer busy waits are usually application level contention for buffers in the cache. • One exception: • P3 value in v$session_wait of “130” • Implies that buffer being read by another session • This is not a contention wait. Can be caused by concurrent table scans accessing the same blocks. • In 10g this is a separate event: “read by other session”
Performance IssuesHigh Wait Time for “Buffer Busy Waits” • Very often the same set of blocks participate in buffer busy waits and in cache buffers chains latch contention. • Segment level statistics in 9iR2 lets you rank objects by buffer busy wait SQL> select object_name, value from v$segment_statistics where statistic_name like 'buffer busy%' and value > 20000; OBJECT_NAME VALUE -------------------- ----- XXX_Q_TABLE 32716 YYY_IX_MSG 47316
Performance IssuesHigh wait time for “Buffer Busy Waits” • Identify the contended classes: A small number of waits for undo headers can cause a huger number of total waits • If buffer busy waits are high and frequently involve undo segment headers consider increasing rollback segments (or using AUM) SELECT class, count FROM V$WAITSTAT WHERE count > 0 ORDER BY count DESC; count 7733082 483004 34710 26325 class Data Block Undo Header Segment header Undo block
Performance IssuesHigh wait time for “db file sequential read” • If wait time for reads is high, consider: • Tuning SQL statements that issue the most disk reads (Sort V$SQL by DISK_READS and BUFFER_GETS) • Growing the buffer cache based on cache advice if the cache appears undersized • If average wait time is high (10+ msec) • Reducing write IOs (tune down checkpointing) • Adding more IO capacity
Performance IssuesHigh wait time for “free buffer waits” • If time spent waiting for reads is also high, this is probably an IO capacity problem • Over-aggressive checkpointing can also cause this: dbwriter spends most of its bandwidth writing out hot buffers and doesn’t clean the cold buffers • If neither of the above is true, consider increasing dbwriters
Performance IssuesEasier Performance Troubleshooting in 10g • Automatic Database Diagnostic Monitor (ADDM) will automatically generate recommendations. • Session states are constantly sampled by MMON • Samples are logged in a system-wide history buffer: V$ACTIVE_SESSION_HISTORY • The history is periodically written to disk (Automatic Workload Repository or AWR) • ADDM analyzes the samples and quickly identifies the top SQL and top objects associated with the different waits making these drilldowns easier
Performance IssuesEasier Performance Troubleshooting in 10g • A few other performance debugging aids: • V$EVENT_HISTOGRAM: histogram of wait-time distributions for different wait events • V$FILE_HISTOGRAM: histogram of IO time distributions on different datafles • V$SESSION_WAIT_HISTORY: history of recent waits by each session
New 10g Functionality • Prewarm buffer cache • Preloads buffer cache after startup allowing faster rampup • No user intervention needed, works transparently • Fast drop/truncate • Avoids full cache scans for drops and truncates. • Time reduces from minutes to seconds on a large cache • ALTER SYSTEM FLUSH BUFFER_CACHE • For testing purposes only • Allows apps developers to purge previous cached contents • Successive test runs can start from a clean buffer cache
Automatic SGA Memory ManagementOutline • Overview of SGA • Dynamic SGA • Memory Advisors • Drawbacks of Manual SGA Tuning • Introducing Automatic SGA Memory Management • Overview of Automatic SGA Management • Benefits of Automatic SGA Management • Using Automatic SGA Management • Automatic SGA Management Architecture • Summary
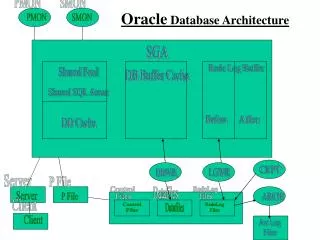
Shared Pool Database Buffer Cache Redo Log Buffer Java Pool Large Pool Fixed SGA SGA Overview of SGA • SGA: Oracle’s “Shared Global Area” • This is a shared memory region shared by different Oracle processes
Overview of SGA • The SGA comprises multiple components: • Shared pool: Mostly for caching shared cursors • Buffer cache: Cache of disk data • Large pool: Large allocations (e.g. RMAN backup buffers, PQ message buffers, etc.) • Java pool: Java allocations and for caching java objects • Log buffer: In memory buffer for redo generation • Streams Pool: New in 10g, for buffering inbound and outbound logical change records