Metrics
220 likes | 368 Views
Metrics. Project and Process Metrics. Why do we measure?. Assessing project status Allows us to track risks Before they go critical Adjust workflow See if the team can control the quality of artifacts. Example metric.

Metrics
E N D
Presentation Transcript
Metrics Project and Process Metrics
Why do we measure? • Assessing project status • Allows us to track risks • Before they go critical • Adjust workflow • See if the team can control the quality of artifacts
Example metric • Can you calculate a metric that records the number of ‘e’ that appear in a program • Should you?
Effective Metrics • Simple and computable • Empirically and intuitively persuasive • Consistent and objective • Consistent in use of units and dimensions • Programming language independent • Should be actionable
Example metric • If I calculate the number of defects per developer and rank them, then using that rank assign salary raises based on that.
Metrics Guidelines • Don’t use a single metric to the exclusion of others • Metrics should not be used to appraise or threaten individuals • Negative metric should be viewed as an opportunity for improvement
Process vs Project Metrics • Process across multiple projects • i.e. Waterfall vs Agile • Quality: correctness, maintainability, usability, integrity • Productivity: earned value analysis • Statistical SQA data: MTTF, MTTR • Defect removal efficiency (later) • Reuse data: percent of components
Defect Removal Efficiency • E is the number of errors found before delivery of the software to the end-user • D is the number of defects found after delivery. DRE = E /(E + D)
DRE Example DRE = E /(E + D) Defects found during phase: Requirements (10) Design (20) Construction Implementation (5) Unit Testing (50) Testing Integration Testing (100) System Testing (250) Acceptance Testing (5) By Customer (10) 10 / (10 + 20) = 33% What are the rest?
Size Oriented Metrics • errors per KLOC (thousand lines of code) • defects per KLOC • $ per LOC • pages of documentation per KLOC • errors per person-month • Errors per review hour • LOC per person-month • $ per page of documentation
LOC is dangerous • A Function Point is an estimate of a unit of utility/productivity • LOC does not generalize across multiple languages
Other problems with LOC • At IBM in the 70s or 80s (I don’t remember) they paid people per line-of-code they wrote
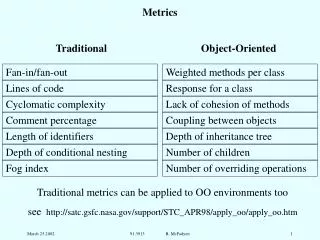
Object Oriented Metrics • Number of scenario scripts (use-cases) • Number of support classes (required to implement the system but are not immediately related to the problem domain) • Average number of support classes per key class (analysis class) • Number of subsystems (an aggregation of classes that support a function that is visible to the end-user of a system)
Questions/Review • What are some reasons NOT to use lines of code to measure size? • What do you expect the DRE rate will be for the implementation (or construction) phase of the software lifecycle? • What about for testing? • Give an example of a usability metric? • According to the chart, Smalltalk is much more efficient than Java and C++. Why don’t we use it for everything?
Code Metrics • Static • Cyclomatic complexity • Readability • etc. • Dynamic • CPU performance • Memory usage • Threading
Cyclomatic Complexity • A software metric used to measure the complexity of software • Developed by Thomas McCabe • Described (informally) as the number of simple decision points + 1
What is cyclomatic complexity? • Essentially the number of linearly independent paths through the code • The code has no decision statements: complexity = 1 • The code has an if statement, there are two paths through the code: complexity = 2 • Used as a basis for path testing
Example • What is the complexity: public void howComplex(inti) { while (i<10) { i++; System.out.printf("i is %d", i); if (i%2 == 0) { System.out.println("even"); } else { System.out.println("odd"); } } }
When do we care? A number of industry studies have indicated that the higher V(G), the higher the probability or errors. modules V(G) modules in this range are more error prone
Tools will automatically calculate • NCSS = Non Commenting Source Statements • CCN = cyclomatic complexity number