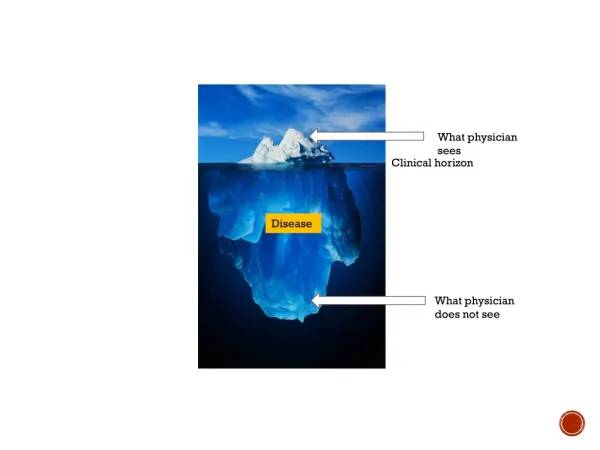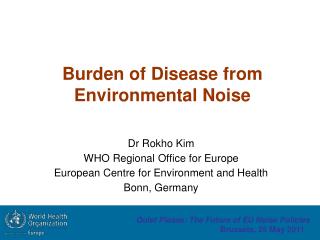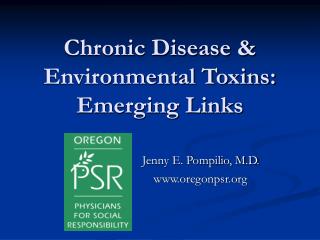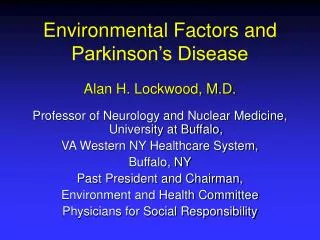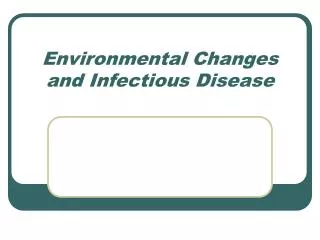
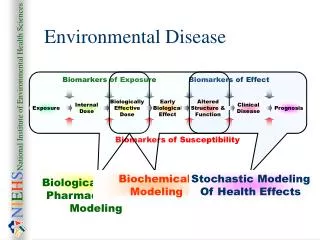
Environmental Disease
Biomarkers of Effect. Biomarkers of Exposure. Exposure. Internal Dose. Biologically Effective Dose. Early Biological Effect. Altered Structure & Function. Clinical Disease. Prognosis. Biomarkers of Susceptibility. Biologically-Based Pharmacokinetic Modeling. Biochemical

Environmental Disease
E N D
Presentation Transcript
Biomarkers of Effect Biomarkers of Exposure Exposure Internal Dose Biologically Effective Dose Early Biological Effect Altered Structure & Function Clinical Disease Prognosis Biomarkers of Susceptibility Biologically-Based Pharmacokinetic Modeling Biochemical Modeling Stochastic Modeling Of Health Effects Environmental Disease
Stochastic Modeling and Risk Assessment Group - LCBRA • In each focused research area • mathematical and statistical methods • novel modeling structures • strong biological linkage • analysis tools for DIR scientists • translation from the laboratory to health policy • qualitative • quantitative
Gut Lumen GI Tract Capillary Blood QA QV VB Arterial + Venous Blood Vi,ki Vm,km Metabolite to Feces Oral Dose VL metabolite Liver TCDD VG biochemistry QG 80% PG,FG PL,FL Capillary Blood QL 20% PKi,FKi QKi Vu,ku VKi Fat VF Metabolite to Urine QF Rapidly Perfused Local Skin PF,FF Capillary Blood QM PM,FM VR VM Muscle QR PR,FR PSr,FSr Capillary Blood Capillary Blood Capillary Blood QSr VSl VSr Topical Dose Remote Skin Kidney Vt,kt QSl Capillary Blood Capillary Blood PSl,FSl PBPK Model for Dioxin
1,3-butadiene Methyleugenol Anthraquinone Sodium Nitrite Dichloromethane PCB’s Primidone AZT Melatonin Estrogen, progesterone, etc. Other PBPK Models
Uses of PBPK Models • Test hypotheses • Shape of exposure/internal dose • Equivalence of metabolism, etc. across species, sexes • Prediction • Equivalent exposures for a given risk • Design experiments • Tissue concentrations
Metabolite Capillary Blood CYP1A1 DNA Damage + Metabolism TCDD+Ah Ah.TCDD CYP1A2 CYP1B1 + Cell L ysis + E OH - Bound TCDD 2 + + (CyP1A2) ER Growth E Signal 2 + ER.E 2 Growth Liver Peptide EGFR Liver Interstitium TCDD Liver Biochemistry TCDD
TCDD Transcriptional Activation Liganded Ah Receptor • Message includes poly(A) tail • Poly(A) nuclease degrades tail • 24 nt/hr • Message removed after tail • 1.2 hours T1/2 • Ribosome binding protects message TCDD Bind to Dioxin Responsive Elements Low-affinity Binding Site High-affinity Binding Site
Other Biochemical Models • Privileged Access Model • Localized metabolism • Cell-Cycle Kinetics • G0-G1 in hepatocytes • Receptor binding/gene expression • Sodium channel kinetics
Uses of Biochemical Models • Hypothesis testing • Proposed mechanisms • Alpha-2U • TCDD activates • Epoxide is the penultimate carcinogen • Thresholds • Equivalence across species, sex • Prediction • Mechanism-based extrapolation • Use of in-vitro data • Impact of genetic polymorphisms • Impact of competition for binding sites • Identify data gaps
Normal Cells Initiated Cells Malignant Cells bI(t,d) bN(t,d) bM(t,d) mI(t,d) mM(t,d) dI(t,d) dN(t,d) dM(t,d) Simple Two-Stage Cancer Model
Combining Two-Stage and PBPK Number of Skin Papillomas Dioxin Dose
576 Cells 956.5 Cells 0 birth/day 0.4 deaths/day 288 Cells 144 Cells 72 Cells 36 Cells 18 Cells 0.66 births/day 0 deaths/day 2112 Cells 9 Cells 4.5 Cells 0.33 birth/day 0 deaths/day 9 Stem Cells Colonic Crypts Steady State Size • 2250/crypt • ? stem cells/crypt • Tc=24h • ~ 150 proliferative cells • Tc>36h • 5-6 transit generations • T=36-96h
Stage 0 Stage 1 Stage 2 μ0 μ1 Normal Stem Cells Initiated Stem cells Malignant Cells Stem cells Birth β0 β1 μ0 μ1 1st level daughter 1st level daughter Replicating cells (Capable of independent growth) δ1 6 steps in initiated cells β0 β1 δ0 fixed at 3 1st level differentiated daughter 1st level differentiated daughter δ0 δ1 β1 β0 Terminally differentiated cells fixed at 2 Terminal cells Terminal cells Deathδ1 Deathδ0 Two-Stage Model with Controlled Replication
Rates (scaled) Cancer Survival Iteration Number Age (months) Frequency Frequency Mutation Rate Birth Rate Five Stage Colon Cancer Model
Concerning model Your concern model 5-3, 13-3 4-stage model. Alpha% cells start from stage 1.
Cancer New methods Observable tumors Physiologically realistic models Better statistical approaches MCMC Hypothesis testing Prediction of risk Other Endpoints Development Spermatogenesis Controlled differentiation Pharmacology Stochastic processes Other Stuff Data analysis Graph theory Uses of Stochastic Models
Population Organism Organ System Tissue/Organ Health Risks Cellular Biochemical Environmental Exposures Molecular and Genetic