Download
1 / 16
160 likes | 298 Views
Robust Designs for WDM Routing and Provisioning. Jeff Kennington & Eli Olinick Southern Methodist University. Augustyn Ortynski & Gheorghe Spiride Nortel Networks. LTE. LTE. LTE. LTE. …. …. LTE. LTE. LTE. LTE. LTE. LTE. …. …. LTE. LTE. Equipment modeling – sample network link.

E N D
Robust Designs for WDM Routing and Provisioning Jeff Kennington & Eli Olinick Southern Methodist University Augustyn Ortynski & Gheorghe Spiride Nortel Networks
LTE LTE LTE LTE … … LTE LTE LTE LTE LTE LTE … … LTE LTE Equipment modeling – sample network link TE LTE TE LTE LTE TE LTE TE … … … … TE LTE TE LTE LTE TE TE LTE LTE TE LTE TE … … … … LTE TE TE LTE
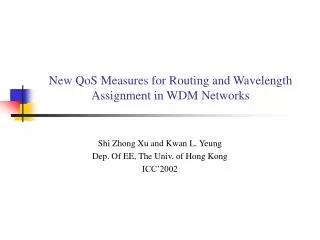
UnderprovisionedCase Dallas Atlanta Unmet demand Satisfied demand Excess capacity Perfect MatchCase LA Phoenix OverprovisionedCase Boston NYC
Regret UnderprovisionedCase OverprovisionedCase Underprovisioning Overprovisioning Perfect MatchCase
Regret UnderprovisionedCase OverprovisionedCase Underprovisioning Overprovisioning Perfect MatchCase
If the point-to-point demands are known, then we can develop a perfect design. If the demands (which are forecasts) are not known with certainty, then we develop a design that attempts to minimize regret over a range of possible demands.
Example 2 Boston Chicago San Francisco 3 6 7 New York Los Angeles 5 1 4 Atlanta Dallas
Scenario #1 Solution 2 Boston Chicago San Francisco 3 6 7 New York Los Angeles 5 1 4 Atlanta Dallas
Scenario #2 Optimal Solution 2 Boston Chicago San Francisco 3 6 7 New York Los Angeles 5 1 4 Atlanta Dallas
Scenario #3 Solution 2 Boston Chicago San Francisco 3 6 7 New York Los Angeles 5 1 4 Atlanta Dallas
Robust Solution 2 Boston Chicago San Francisco 3 6 7 New York Los Angeles 5 1 4 Atlanta Dallas
The End