Download
1 / 19
190 likes | 302 Views
W and Z boson measurements in Pb + Pb collisions at =2.76 TeV with the ATLAS detector. Jiří Dolejší Charles University Prague for the ATLAS collaboration QM 20 12 , Washington DC. Z boson production Run 2010: Z mm decays using 6.7 μ b -1

E N D
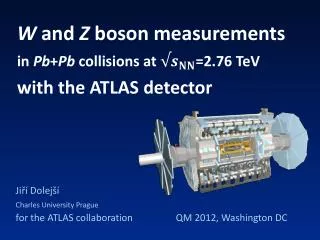
W and Z boson measurements in Pb+Pbcollisionsat =2.76 TeV with the ATLAS detector JiříDolejší Charles University Prague for theATLAS collaborationQM 2012, Washington DC
Z boson production • Run 2010:Z mmdecaysusing6.7 μb-1 • (Phys.Lett. B697 (2011) 294-312) • Run 2011:Zmmand Z eeusing 0.15 nb-1 • W boson production • measured via single muons (W mn) from 5 mb-1of 2010 run. • W & Zbosons are expected to beproduced in initial NN collisions and theirdecayproducts to traverse thedense and hot medium unaffected … • YieldsscalingwiththenumberofbinaryNNcollisonscan and shouldbetested • W&Z canbeused as a tagforjets • Productioncanprovideinformation on nuclear PDF‘s
Z boson production Z eecandidate. FCalSum ET = 0.42 TeV(40-50 % Centrality), mee= 90.8 GeV, pTof Z = 1.6 GeV, yZ= -0.2.
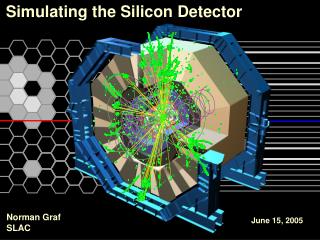
Overviewof ATLAS subdetectors InnerDetector: Tracking in 2 T fieldin therange||< 2.5 Pixels SCT TRT Calorimeters: EM LAr||< 3.2 Tilecal||< 1.7 LArhadronic EC 1.5 < ||< 3.2 LArFCal 3.1 < ||< 4.9 LAr Tilecal
Overviewof ATLAS subdetectors Muon system Precisiontracking (MDT, CSC)for ||< 2.7 Trigger (RPC, TGC) within ||< 2.4 SCT TRT
Z boson production – eventselection • Trigger: Minimum Bias:ET > 50 GeV OR both ZDC & ID track • e-candidates: L1 EMcaloclustersET > 14 GeV • m-candidates: L1 mtriggerwithpT > 4 GeV, HLT (MS OR MS + ID), additionalpT> 10 GeVmuonscan
Z boson production – eventselection • Collision centrality is characterised by classes according to the FCal (modelisbased onGlauber MC) • Centrality parameterslike • <Npart>, <Ncoll> calculatedfrom Glauber MC
Zproduction – e, mselection and efficiencies • e: ||< 2.5, ET > 20 GeV, ID track matchingLAr cluster, matchingcriteriamodifiedwrtpp, underlyingeventsubtracted • m: „highquality“… MS & ID, combined. Whenbothm‘sh.q. pT > 10 GeVrequiredforboth, • Whenonlyoneh.q. pT > 20 GeVrequiredforboth. … very weak centrality dependence
Z boson production – correcteddistributions Yields for each centrality bin are comparedto model … Pythia NNLO with proper TAA • Spectra in all centrality bins are consistentwiththe model employingthebinaryscaling
Z boson production – correcteddistributions Model … … Pythia NNLO with proper TAA • Rapidityspectrumisconsistentwiththe model employingthebinaryscaling
Z boson production – binaryscaling ZyieldsfromZ eeand Z mm are consistentwitheachother and are consistentwithbinaryscaling.
Z boson production – zeroflow? • v2= −0.015 ± 0.018(stat) ± 0.014(sys)
W boson production in mnchannel • … single muonmeasurements in Minimum Biasevents UncorrectedinclusivemuonpTspectrum. Fit (solid line) withtwocomponents: signalW mn(shadedarea) simulatedwith PYTHIA in NN, and a backgroundparametrisation (dashed line) fromcc m + X and bb m + X in ppsimulations.
W boson production – binaryscaling Yields for each centrality bin are normalized to the themost central bin. RPC (peripheral to central ratio) consistentwith unity
W boson production – W+/W- and W/Z Measured ratio RW+/W- = 0.97 + 0.18 - 0.19, to becomparedwithRW+/W- = 1.65 ± 0.03 forpp and RW+/W- = 0.62 ± 0.03 fornncalculatedwith NNLO QCD usingMSTW2008 PDF‘s*. MeasuredRW/Z= 10.5 + 2.3 - 2.4, to becomparedwithabovementioned NNLO QCD* givingRW/Z = 11.3 ± 0.6 forppand RW/Z = 10.8 ± 0.6 fornn. *A.D.Martin et al. Eur. J. Phys. C 14 (2000) 133
Summary • ATLAS measured a totalof 772 Z eeand 1223 Z mmcandidateswithin |yZ| < 2.5 and 66 < mll < 102 GeVin the 2011 PbPb data. • ATLAS measured a totalof 399 +36-38 W bosons in the 2010 PbPb data. • ThetotalZ and W yieldsintegratedoverrapidity are consistentwithbinaryscaling. • Zellipticflowconsistentwithzero. • ATLAS measured ratia RW+/W-and RW/Z.
Sourcesoffurtherinformation ATLAS Public Results https://twiki.cern.ch/twiki/bin/view/Atlas/AtlasResults Especially notes ATLAS-CONF-2012-052 and ATLAS-CONF-2011-078