Download
1 / 130
1.3k likes | 1.34k Views
This article provides an in-depth look at Business Process Model and Notation (BPMN) simulation, focusing on its fundamentals and the specific application of simulation in Bizagi. Topics covered include the key elements of BPMN simulation, the importance of simulation in evaluating performance, reducing bottlenecks, and optimizing system efficiency. The guide also includes a step-by-step approach to creating and running simulation models in Bizagi, as well as tips on interpreting and presenting simulation outcomes effectively. Whether you are new to BPMN simulation or looking to enhance your skills in Bizagi, this comprehensive guide is a valuable resource.

E N D
BPMN Fundamentals:3. BPMN Simulation Romi Satria Wahonoromi@romisatriawahono.nethttp://romisatriawahono.net/bpmnWA: +6281586220090
Romi Satria Wahono • SD Sompok Semarang (1987) • SMPN 8 Semarang (1990) • SMA Taruna NusantaraMagelang (1993) • B.Eng, M.Eng and Ph.Din Software Engineering fromSaitama University Japan (1994-2004)Universiti Teknikal Malaysia Melaka (2014) • Research Interests: Software Engineering,Machine Learning • Founder danKoordinatorIlmuKomputer.Com • Peneliti LIPI (2004-2007) • Founder dan CEO PT Brainmatics Cipta Informatika
Course Outline • Introduction • BPMN Elements 3.1 Swimlane 3.2 Connecting Objects 3.3 Flow Objects 3.4 Artifacts • BPMN Simulation • BPMN Refactoring • BPMN Guide and Examples
3. BPMN Simulation 3.1 Introduction to Simulation 3.2 Process Validation 3.3 Time Analysis 3.4 Resource Analysis 3.5 Calendar Analysis
What is Simulation • Simulation is a tool: • to evaluate the performance of a model, under different configurations and over long periods of real time • to reduce the chances of failure to meet specifications, to eliminate unforeseen bottlenecks • to prevent under or over-utilization of resources (including people and money) • to optimize system performance • Simulation requires a clear objective to get maximum value for effort • This objective strongly influences the level of detail in the required data
What is Simulation • Randomness is simulated by: • Using probabilities for sequence flows and token routing • Using statistical distributions to reflect variability in process times of activities etc • To make sure results are valid: • the simulation needs be run for long enough to yield random behavior without chance • Provision should be made to compare results from the same scenario, but different run lengths or replications • The required run length to yield usable outcomes depends on the process model structure, amount of variability and the objective • Consequently, a single recommended run length cannot be provided • A replication shares the same scenario configuration and runs for the same length of time, but uses an alternative random stream
Simulation in Bizagi • BizagiModeler allows simulation your business processes under the BPSim (Business Process Simulation) to support decision making and boost their continuous improvement • To start using simulation in Bizagi all you need is a complete Process model • otherwise, it will not be able to be simulated • For a complete simulation analysis we recommend using four levels: • Level 1 -Process Validation • Level 2- Time Analysis • Level 3 - Resources Analysis • Level 4 - Calendars Analysis
Simulation in Bizagi • Each subsequent level incorporates additional information that adds more complexity, providing a coherent analysis of your processes • Levels are not interdependent, you may start at any level if you hold the required process data • By default the Simulation mode will start at Level one, the first time a Simulation is run for the process model • It is best practice to start simulation at level one, and progress one level at a time • It is possible to move between levels at any time • For each simulation level follow these steps: • Collect process data for the simulation • Add the data to the relevant shapes in the diagram • Interpret and present the outcomes
Supported Elements and Diagrams • The following BPMN elements are not supported by the simulation engine: • Multiple events: Start, Intermediate and End • Complex gateways • Event based gateways followed by none intermediate events or tasks. • Multiple instance tasks • Multiple instance Sub-processes • The following diagrams are not supported by the simulation engine: • BPMN Choreography diagrams • BPMN Conversation diagrams • Transactional process • Ad Hoc process
How to Create and Run Simulation Models? 1. Click Simulation View to simulate your process model
How to Create and Run Simulation Models? 2. The shapes that require information will be highlighted
How to Create and Run Simulation Models? 3. Select highlighted shape in turn and enter the information
How to Create and Run Simulation Models? 4. Click Run to launch the Process Simulation
How to Create and Run Simulation Models? 5. Click Start to run the simulation
How to Create and Run Simulation Models? 6. Click Stop to stop the simulation
How to Create and Run Simulation Models? 7. Click Results to view the outcomes
How to Create and Run Simulation Models? 8. Click the Export to Excel button
How to Create and Run Simulation Models? 9. Process to the next level and repeat step 1-8
How to Create and Run Simulation Models? 10. Click Close Simulation View to return
Simulation Levels • Bizagi Simulation comprises of four levels • Each subsequent level incorporates additional information exhibitingmore complexity than the preceding one, thereby providing a detailed analysis of your processes • Levels are not interdependent, you may start at any level if you hold the required process data
Level 1 - Process Validation • The first and most basic simulation level to evaluate the structure of the process diagram • Data: • It requires estimated percentage splits of sequence flows to provide a basis for routing • It also needs the value of the trigger counter contained in the Start Event shape • Results: • The outcomes show all paths activated during the execution and whether all tokens actually finished • It evaluates how many tokens passed through each Sequence Flow, Activity and End Event
Level 2 – Time Analysis • Second level of simulation to measure the end-to-end process time • Data: • Apart from the data entered in Process Validation, estimated timings (service times) of each activity and the interval time between token generation is required • This data can either be constant or samples from statistical distributions • Results: • The results show process throughput times for tokens, presented as minimum, maximum, mean and sum (total of all processing times) • Similar results can be presented for individual key activities
Level 3 – Resource Analysis • Predicts how the process will perform with different levels of resources. This level of detail provides a reliable estimate of how the process will perform in operation • Data: • In addition to the data entered in Time Analysis, this level includes the definition of resources (and/or roles): how many are available and where they are used • Due to the inclusion of resources, the activity times should be adjusted to represent the actual work time; delay due to unavailability of staff will be explicitly indicated • Results: • The structure of the results is similar to Time Analysis • The time spent, the time spent busy or idle for each type of resource is presented • This level assume an unlimited number of resources
Level 4 – Calendar Analysis • Includes calendar information that reflects the process performance over dynamic periods of time, such as shifts, days schedules or weeks • By default Bizagi includes a chosen calendar that works 24/7 • If no calendars are defined, Bizagi will assume that the defined Resources will always be available • Data: • Apart from the data entered in Resource Analysis, it includes the definition of resource calendars • Results: • The structure of the results is similar to Resource Analysis
Case Study: Patient Assistance • A call center receives a report of an emergency. A call centeragent enters details on the person affected, the symptoms and the physical address • A qualified nurse classifies the emergency according to its severity • Green: Low severity. The patient can be easily stabilized • Yellow: Medium severity. The patient requires special attention but can be stabilized at the place of emergency • Red: High severity. The patient must be collected and taken to the nearest hospital • According to the priority assigned, the Emergency attendance department presents a different level of response • Green: This triage is assisted by a quick response vehicle carrying two people: a paramedic and a doctor • Yellow: This triage is assisted by a basic ambulance having a doctor, nurse and a paramedic on Board • Red: This triage is assisted by a fully equipped ambulance holding two doctors, a nurse and a paramedic • If the emergency is green or yellow, the process finishes once the response team arrives at the at the place of emergency • If the emergency is red, the fully equipped ambulance transfers the patient to the nearest hospital • During the transfer a nurse carries out the necessary paperwork to ensure quick admittance • When the patient arrives at the hospital with the necessary paperwork, the receptionist will be able to admit the patient quickly and provide medical assistance immediately • This process must be carefully analyzed in order to reduce the time between receiving the request and providing medical assistance
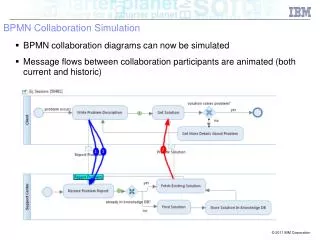
Overview • The first level of the simulation validates the Process Model, making sure the process passes through all the sequence flows, and behaves as expected • Resources, processing times and costs are not included in this level • Such parameters will be included later in subsequent levels • When validating a Process Model the simulation results will show if: • Gatewaysare synchronized • Messagesare synchronized • Decisions probabilities are correctly assigned • Routingbehaves as expected • All tokens have ended • Bizagioffers real-time animation of simulations to easily identify problems. The Results report will show the behavior during execution
1. Defining the Input Data Required for This Level • In the Process Validation level you will note that only Start Events and Gateways are enabled for editing • For this level you need to define: • Max.arrival count: • Define the number of token instances the process will generate • We recommend defining a large enough number (at least 1000) to allow the execution to stabilize and present reliable outcomes • Select the Start Event of the process and click the Gear icon on the pie menu. Enter the Max.arrival count in the pop-up window • Gateways routing: • Inclusive and exclusive Gateways have activation probabilities • Probabilities are values between 0 and 100% • Select the Gateway and click the scroll arrow icons (icon) to set the probabilities.
2. Running the simulation • Once the required data for this level have been defined, click the Run button to execute the simulation • In the new window, click Start to run the simulation
Analysis Data Display • Number of completed tokens • Number of token instances created • Number of instances that activate each shape • Number of finished instances
3. Results When the simulation is finished, view the results by selecting the Resultsoption
Result Display • Name: Identifies the specific BPM shape for which the results are displayed • Type: Identifies the element type of the BPM shape • Tokens completed: Indicates how many tokens were processed (instances) during the execution of the simulation
2. Define the Probabilities for All Outgoing Pathsof the Gateway • Suppose the emergency department has estimated, based on historical data, that the probabilities for the different sequence flows are: • Green: 20% • Yellow: 30% • Red: 50% • Define each probability for the Gateway named Triage type.
4. Analyzing the Results • Analyzing the results we conclude that something is wrong: • The number of tokens (1000) created at the Start Event of the process differs to the sum of tokens completed at the End Events (1006+311+186) • Can you identify what is wrong in the flow?
Problem If you watch the diagram carefully, you will see there is no point of convergence, that is, no shape has been defined to synchronize the paths that exit the Parallel Gateway
5. Solution • It is necessary to merge the outgoing flows into a single flow before the token continues to the next activity • To do this, include a Parallel Gateway (as a convergence element) to synchronize them
Solution • Once the change is done, Run the simulation again • Looking at the new results we can see that all is working as expected: • The number of tokens created (1000) is equal to the sum of tokens completed (483+315+202) • In addition, each token is passed correctly to the triage based on the probabilities defined
1. Defining the input data required for this level • Arrival interval time: • Defines the time interval between token instances generation • Instances will be created until the max.arrival count is reached • This applies to Start Events, Activities that start processes or Timer Events • Select the Start Event of the process and click the Gear icon on the pie menu. Set the value for the control • One option is to define the arrival interval time as a constant by entering a value. The time units for this value are defined in the scenario´s configuration