Download

1 / 7
70 likes | 205 Views
This resource guides learners in understanding pull factors influencing immigration and teaches them how to create, interpret, and utilize circle graphs. Focusing on recent immigrant population data from Canadian metropolises in 2001, the activity involves calculations and visual representations, including adding titles, legends, and sources to the graphs. Using Statistics Canada data, students will learn to analyze population percentages and graphically display this information effectively. Ideal for enhancing skills in data interpretation and graphical presentation.

E N D
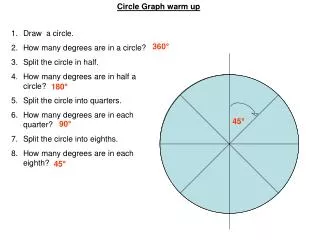
I can… • Understand the concept of a pull factor and the reasons that cause pull factors to change in time and space. • Create, interpret and use circle graphs.
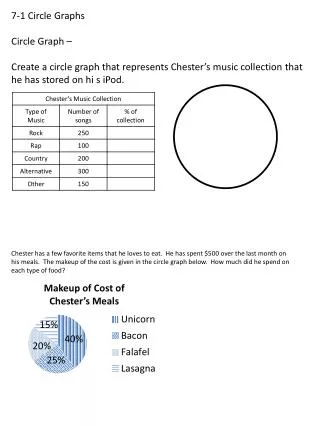
Recent Immigrant Population in Canadian Metropolises (2001) • source: Statistics Canada
18o or 5% 0o or 0% 36o or 10% 54o or 15% 72o or 20% 90o or 25%
Draw in a 0% or a 0o line Label each section with the associated %. 2% 13% 61% 19% Draw a line at 61% or 220o and shade in the section 5% Create and shade in the remaining sections.
Add a Page Title… Add a Graph Title Add a Graph Title Legend… Add a Graph Title Add a Graph Title Source… Author…