Download
1 / 19
190 likes | 352 Views
Analysis of Ocean Color Algorithms for Lake Erie. Raghavendra S. Mupparthy Carolyn J. Merry. Outline. What are ocean color algorithms? Case - 1 & 2 waters NASA’s SeaWiFS project goals Introduction to the study area In situ pigment data In situ optical measurements

E N D
Analysis of Ocean Color Algorithms for Lake Erie Raghavendra S. Mupparthy Carolyn J. Merry
Outline • What are ocean color algorithms? • Case - 1 & 2 waters • NASA’s SeaWiFS project goals • Introduction to the study area • In situ pigment data • In situ optical measurements • Methodology and validation approach • Results and discussion • Conclusions • Q&A
Ocean Color Algorithms • What are ocean color algorithms? • An ocean color algorithm combines the reflectances at blue and green wavelengths to estimate the chlorophyll-a concentration in the surface layer of the ocean. • Types of Ocean Color Algorithms: • Empirical algorithms • For example, OC4v4: [C] = 10^(0.366-.067*R+1.930*R^2+0.649*R^3)-1.532 • where: R = max {log10(Rrs(443)/Rrs(555)), log10(Rrs(490)/Rrs(555)), log10(Rrs(510)/Rrs(555))} • Developed by using SeaBAM dataset. • Semi-analytical algorithms • For example, Garver/Siegel Model
Morel Classification: Case-1 & 2 waters • Case-1 waters: • Optical properties of the water are due to the presence of phytoplankton and their immediate derivatives (decayed organic matter). • Simple to relate to chlorophyll-a concentration. • Open oceans and seas, ~90%. • Case-2 waters: • Complex optical properties due to terrigenous material, sediment, river flow, CDOM. • Coastal areas, lakes, estuaries, bay and rivers, ~10% • Most OC algorithms are focus on case-1 waters.
SeaWiFS project goals • SeaWiFS was launched on 1 August 1997. This is the first ocean color sensor after CZCS. • NASA’s SeaWiFS project goals: • An uncertainty of 5% in determining water-leaving radiance in clear-water regions. • An uncertainty of ±35% in the estimation of chlorophyll-a concentrations over the range of 0.05 – 50 mg/m^3 for case-1 waters (Hooker and McClain, 2000). • Hence, any ocean color algorithm must satisfy this criteria. • As a part of GLFS laboratory at The Ohio State University, we have been archiving SeaWiFS data for the Great Lakes since September 1997.
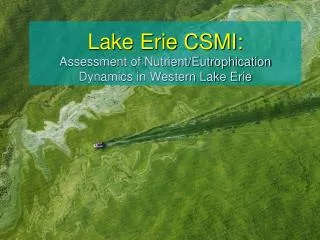
Lake Erie and in situ stations The drainage basin of the Great Lakes (obtained from the Great Lakes Atlas) Study area • Lake Erie is the shallowest of the Great Lakes (18.9 m). • Warmest and biologically most productive lake. • Moderately eutrophic to mesotrophic conditions. • The recurring microcystis bloom every summer is an ecological event to be closely monitored and studied.
Study area (Cont’d) • Field trips: • 19 October 2000 (JD:293) • Stations: E293A and E293B • 31 October 2000 (JD:305) • Stations: E305C and E305D • What data was collected? • In situ chlorophyll-a concentration data • In water optical profiles of upwelling and downwelling radiance.
In situ pigment data • Represented as Cinsitu. • Considered as ground truth. • Station C is the shallowest with [C] > 25 mg/m^3. • Possible bottom reflectance at E305C.
SPMR SMSR In situ optical measurements • SPMR profiles in free-fall mode. SMSR just floats on the water surface. • Both these instruments are used in tandem. • SMSR has 13-channel looking-up sensor. SPMR carries a 13-channel sensor, both looking up and looking down. • The 13 channels in the visible range are – 400, 412, 443, 470, 490, 510, 532, 555, 590, 620, 665, 683, and 700 nm. • The instrument was deployed within the 4-hr window of the SeaWiFS overpass and 8 measurements were made at each station.
In situ optical measurements (cont'd) • What parameters are being measured? • Ed, downwelling irradiance (μW/(cm2.nm), • Lu, upwelling radiance (μW/(cm2.sr.nm) Optical profiles obtained from the SPMR for sample station C
Methodology In situ Data Satellite data SeaWiFS L1A data (Raw radiance counts) Chl-a concentration, (Cinsitu) Satlantic profiler data, Ed(λ, 0-) and Lu(λ,0-) Atmospheric correction using Siegel’s algorithm in SeaDAS v4. Rrs(λ) and Lwn(λ) Lu(λ, 0+) = 0.54 * Lu(λ, 0-) Ed(λ, 0+) = 1/0.96 * Ed(λ, 0-) Rrs(λ, 0) = Lu(λ, 0+) / Ed(λ, 0+) SeaWiFS L2 data Rrs(λ) and Lwn(λ) (3x3 pixel box) Chl-a estimation by 17 Ocean Color algorithms Cmod and Csat Comparison with sea-truth and error analysis Satlantic estimate: %Emod = avg(Cmod) - avg (Cin situ))/ avg (Cin situ) * 100 Satellite estimates: %Esat = avg(Csat) - avg (Cin situ))/ avg (Cin situ) * 100
Methodology (cont'd) • Comparisons were made to identify better performing algorithms for the given region of lake, during the observed time period. • The comparison criteria is separated into 2 cases: • Without atmospheric effects – Satlantic estimates. • With atmospheric effects – SeaWiFS estimates. • For each of the 2 cases: • Algorithms that satisfy SeaWiFS projects ±35% uncertainty criteria for the given data is identified. • Top 3 algorithms are identified based on: • Station E293A and E305D (moderate chl-a range). • Station E305C (high chl-a range) • All stations.
Results and discussion • Case-1 scenario – without atmospheric effects • Applying ±35% criteria, the top 3 algorithms are: • Most algorithms even without atmospheric interference underestimate chlorophyll-a concentration at E305C. • Most probable reason would be the bottom reflectance, as E305C is shallow (~10.4 m) • Also, most algorithms (10/17) seem to overestimate concentrations for E305D.
Results and discussion (cont'd) • Case-1 scenario – without atmospheric effects • Considering stations E293A and E305D (moderate chl-a range), the top 3 algorithms are: • Considering the station E305C (high chl-a range):
Results and discussion (cont'd) • Case-1 scenario – without atmospheric effects • Considering all stations, the top 3 algorithms are: • Case-2 scenario – with atmospheric effects • Applying ±35% criteria, the top 3 algorithms are: • All the algorithms fail with SeaWiFS data, as best algorithm with lowest average error was CalCOFI-3 (41.1%) • Most of the algorithms overestimate chlorophyll-a concentration. • All algorithms failed for station E305C, with an average error of 76.6%.
Results and discussion (cont'd) • Case-2 scenario – with atmospheric effects • Considering stations E293A and E305D (moderate chl-a range), the top 3 algorithms are: • Considering the station E305C (high chl-a range):
Results and discussion (cont'd) • Case-2 scenario – with atmospheric effects • Considering all stations, the top 3 algorithms are: • All algorithms underestimate chl-a concentration for E305C. • Note: POLDER algorithm does not have the same bands as SeaWiFS, but the performance of this algorithm has been good, with a possibility to improve the regression coefficients with additional in situ data points.
Conclusion • This is the first such attempt to examine different ocean color algorithms and to identify one that represents the regional ecosystem of Lake Erie. • For a optically complex region, like Lake Erie, SeaWiFS offers synoptic view which can be well adapted for the region with a good regional ocean color algorithm. • This study used only four data points, which are temporally confined to the month of October. • A statistically stable algorithm could be identified, if we have more data for Lake Erie. • Atmospheric correction scheme is still an issue. • A robust regional atmospheric correction scheme for SeaWiFS data is needed to obtain statistically more closer results with in situ optical estimates.