Introduction to Line Drawing Algorithms in Computer Graphics
This lecture focuses on fundamental line drawing techniques used in computer graphics, addressing the challenge of rendering straight lines on raster displays. It covers concepts like rasterization and scan conversion, ensuring lines appear straight, properly framed, and consistently bright. We explore various algorithms such as the Direct Scan Conversion method, Digital Differential Analyzer (DDA), and Bresenham’s algorithm, discussing their computational efficiency and practical implementations. Understanding these techniques is vital for accurate pixel representation in graphics programming.

Introduction to Line Drawing Algorithms in Computer Graphics
E N D
Presentation Transcript
UNIVERSITY OF KUFA EDUCATION COLLEGE COMPUTER GRAPHICS Lecture #2 Line Drawing Assoct.Prof. DR. NIDHAL EL ABBADI E-mail : comp_dep_educ@yahoo.com
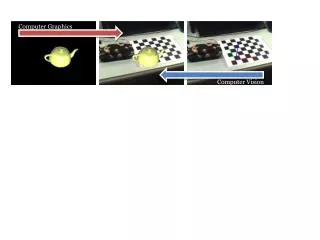
The lines of this object appear continuous However, they are made of pixels
Some useful definitions Rasterization: Process of determining which pixels provide the best approximation to a desired line on the screen. Scan Conversion: Combination of rasterization and generating the picture in scan line order.
• Straight lines must appear as straight lines. • They must start and end accurately • Lines should have constant brightness along their length •Lines should drawn rapidly
For horizontal, vertical and 45º lines, the choice of raster elements is obvious. This lines exhibit constant brightness along the length:
Rasterization of straight lines. Rasterization yields uneven brightness: Horizontal and vertical lines appear brighter than the 45º lines.
The equation of a straight line is given by: y=m.x+b Algorithm 1: Direct Scan Conversion 1. Start at the pixel for the left-hand endpoint x1 2. Step along the pixels horizontally until you reach the right-hand end of the line, xr 3. For each pixel compute the corresponding y value 4. Round this value to the nearest integer to select the nearest pixel
Help for programming x = x1; while (x <= xr){ y = m*x + b; y = Round (y); PlotPixel (x, y); /* Set the pixel at (x,y) on */ x = x + 1; } The algorithm performs a floating-point multiplication for every step in x. This method therefore requires an enormous number of floating-point multiplications, and is therefore more expensive
Algorithm 2 : Digital Differential Analyzer (DDA) The differential equation of a straight line is given by: OR The solution of the finite difference approximation is: You need only compute m once, as the start of the scan-conversion The DDA algorithm runs rather slowly because it requires real arithmetic (floating-point operations).
DDA algorithm for lines with -1 < m < 1 ( No. of Colum more than number of rows) Slope (m) = if x2 – x1 > y2 – y1 Then step on Column and find x x = x1; y = y1; while (x <= xr){ y = y + m; y = Round (y); PlotPixel (x, y); x = x + 1; }
Switching the roles of x and y when m>1 Step on the rows and find y Reverse the roles of x and y using a unit step in y, and 1/m for x. Gaps occur when m > 1
Help to write General program dx = x2 – x1 ; dy = y2 – y1; If dx > dy length = dx ; else length = dy ; Xinc = dx / length ; Yinc = dy / length ; x = x + 0.5 ; y = y + 0.5 ; for ( i=1 ; i <= length ; i++) { putpixel (x, y, c) ; x = x + Xinc ; y = y + Yinc ; }
18 17 16 15 14 13 12 11 10 20 21 22 23 24 25 26 27 28 29 30 Implementation DDA algorithm by hand Dx = 30 – 20 = 10 Dy = 18 – 10 = 8 Larger length = 10 = Dx Yinc = 8 / 10 = 0.8 Xinc = 10 / 10 = 1
Algorithm 3 : Bresenham’s algorithm (1965) This algorithm uses only integer arithmetic, and runs significantly faster. Key idea: (error) is the distance between the actual line and the nearest grid locations. Initialize error: e=-1/2 Error is given by: e=e+m Reinitialize error: when e>0
To draw line with Bresenham’s algorithm follow the following steps In each step change one of the axis in the value 2. The other axis change or not change depended on the value of (error (e)) 3. Determine the largest length ( Dx or Dy ) 4. Loop will be from 1 to largest length 5. Find the initiate value of(e) as following e = - 0. 5 6. Start to draw line with the point ( x1, y1 ) 7. In each step plot-pixel and determine the new values of ( x, y)
8. In each step check sign of (e) 9. If the sign of (e) positive then (y) will be incremented by (1), and subtract one from (e). { in case of Dx is the largest length}, otherwise {if Dy is the largest length then x will be incremented} 10. If (e) is negative or zero, then the value of (y) will remained as it without change. 11. In each step the value of (x) will increase by (1). 12. Also in each step (e) will increase with
However, this algorithm does not lead to integer arithmetic. Scaling by: 2* dx Help for programming void Bresenham (int x1, int y1, int xr, int yr) { int x,y; /* coordinates of pixel being drawn */ int dy, dx; int ne; /* integer scaled error term */ x = x1; y = y1; /* start at left endpoint */ ie = 2 * dy - dx; /* initialize the error term */ while (x <= xr){ /* pixel-drawing loop */ PlotPixel (x,y); /* draw the pixel */ if (ie > 0) { y = y + 1; ne = ne - 2 * dx; /* can replaces e = e - 1 */ } x = x + 1; ne = ne + 2 * dy; /* can replaces e = e + m */ } }
18 17 16 15 14 13 12 11 10 20 21 22 23 24 25 26 27 28 29 30 Go through the steps of the Bresenham line drawing algorithm (by hand) for a line going from (21,12) to (29,16)
In each step (across the X-axis) the height increased with (M) (slop) If H was positive we change the row value and subtract one from height If the slop was gentle H > 0.5 H will be H = H +M OR H = H + M - 1 Rewrite H > 0.5 H- 0.5 > 0 Multiply by 2 get 2H – 1 > 0 Multiply by Dx get 2 . Dx . H – Dx > 0 H = Suppose G = 2 . Dx . H – Dx G > 0
Now how G change from Colum to another If Hnew =Hold + M If Hnew = Hold + M - 1 Key is to use G > 0 instead of use H > 0.5
If the end points was integer numbers the initial value for H equal M Then the initial value for G equal For each Colum check G if it was positive then move to next row and add To G Other wise keep the same row and add To G