Download
1 / 67
680 likes | 889 Views
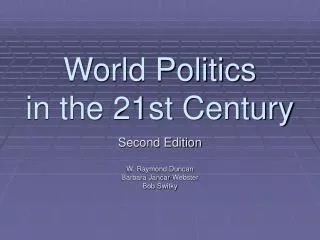
World Politics in the 21st Century. Second Edition W. Raymond Duncan Barbara Jancar-Webster Bob Switky. Chapter One The Importance of International Relations. Figure 1.3 Eight Thousand Years of Changes in the Earth’s Forest Cover:

E N D
World Politics in the 21st Century Second Edition W. Raymond Duncan Barbara Jancar-Webster Bob Switky
Chapter OneThe Importance of International Relations Figure 1.3 Eight Thousand Years of Changes in the Earth’s Forest Cover: The map compares areas of the planet covered by forests 8000 years ago and in 1998. Which continent has lost the most of its original forests? Source: World Resources Institute, Forest Initiative Project (http://www.wri/org/ffi/maps/).
Chapter TwoThe State and Its Role in the International System Figure 2.2 A Multipolar System
Chapter TwoThe State and Its Role in the International System Figure 2.3 Unipolar World on the International System-as-a-Whole Level of Analysis and a Multipolar World at the Regional Level of Analysis
Chapter TwoThe State and Its Role in the International System Figure 2.5 Russia: The Center and the Periphery Source: University of Texas Library Online (www.lib.texas.edu/maps/commonwealth/russiaaddivisions.jpg).
Chapter Three Power Factors in International Relations Figure 3.1 China and the Yangtze River
Chapter ThreePower Factors in International Relations Figure 3.2 Global Illiteracy Rates Source: John L. Allen, Student Atlas of World Politics, Fourth Edition, (Guilford, CT: Dushkin/McGraw-Hill, 2000), p. 66.
Chapter Three Power Factors in International Relations Figure 3.3 Population Growth Rates Source: John L. Allen, Student Atlas of World Politics, Fourth Edition, (Guilford, CT: Dushkin/McGraw-Hill, 2000), p. 60.
Chapter Three Power Factors in International Relations Figure 3.4 An Age of Bipolarity: The Cold War ca. 1970 Source: John L. Allen, Student Atlas of World Politics, Fourth Edition, (Guilford, CT: Dushkin /McGraw-Hill, 2000), p. 26.
Chapter FourForeign Policy Formation and Execution Figure 4.1 Tools for Foreign Policy Implementation Source: The United States Naval War College, National Security Decision Making Department, Case Study, 1992-1993.
Chapter FourForeign Policy Formation and Execution Figure 4.2 Map of Cold War Alignments Source: John L. Allen, Student Atlas of World Politics, Fourth Edition, (Guilford, CT: Dushkin/McGraw-Hill, 2000), p. 21.
Chapter FourForeign Policy Formation and Execution Figure 4.3 Ethnic Distribution of Former Yugoslavia Source: The International Institute for Strategic Studies, Strategic Survey, 1990-1991.
Chapter FourForeign Policy Formation and Execution Figure 4.4 Foreign Policy input-Output Model Source: David K. Hall, “An Introduction to Policy Making and Implementation,” The United States Naval War College, National Security Decision Making Department, Case Study, 1992-1993, p. 3.
Chapter FourForeign Policy Formation and Execution Figure 4.5 Rational Actor [States] Model Source: The United States Naval War College, National Security Decision Making Department, Case Study, 1992-1993.
Chapter FourForeign Policy Formation and Execution Figure 4.6 Organizational Model of Foreign Policy Decision Making Source: The United States Naval War College, National Security Decision Making Department, Case Study, 1992-1993.
Chapter FourForeign Policy Formation and Execution Figure 4.7 Political Process Model Source: The United States Naval War College, National Security Decision Making Department, Case Study, 1992-1993.
Chapter FiveIntergovernmental Actors Figure 5.1 Relationship of Assessments to Voting Strength in the General Assembly Source: Lawrence Zirling, Robert E. Riggs, and Jack C. Piano, The United Nations: International Organization and World Politics. Third Edition (Orlando, FL: Harcourt Brace & Company, 2000), p. 61. Reproduced by permission of the publisher.
Chapter FiveIntergovernmental Actors Figure 5.2 Europe: Distinguishing EU Members, Applicant States, Date of Joining/Application, Non-EU States Source: European Commission from “Europe” Survey, The Economist, October 23, 1999, p. 4.
Chapter FiveIntergovernmental Actors Figure 5.3 Estimated Proven Reserves of Oil Source: From “BP Amoco Statistical Review of World Energy, 2000.” The Economist, July 15, 2000.
Chapter SixCorporate and Nongovernmental Actors Figure 6.1 Growth of NGOs (1956-1999) Source: Union for International Associations as quoted in “Swarming: Non-governmental International Organizations,” The Economist, December 11, 1999, p. 20.
Chapter SixCorporate and Nongovernmental Actors Figure 6.2 Map of China and Tibet Source: A. Tom Grunfeild, The Making of Modern Tibet (New York: M.E. Sharpe, Inc.) 1997, p. ix.
Chapter SevenPolitical Geography Figure 7.1 Major Axes of the Continent Source: Jared Diamond, Guns, Germans, and Steel: the Fates of Human Societies (New York: W.W. Norton, 1998), p. 177.
Chapter SevenPolitical Geography Figure 7.2 The Fertile Crescent Source: www.fsmitha.com/hl/map00fe.html
Chapter Seven Political Geography Figure 7.3 Income Received by the Wealthiest 5 Percent of the Population (Percent of Total Income) Source: IDB calculations based on Deininger and Squire (1996).
Chapter Seven Political Geography Figure 7.3(b) Income Received by the Poorest 30 Percent of the Population (Percent of Total Income) Source: IDB calculations based on Deininger and Squire (1996).
Chapter Seven Political Geography Figure 7.4 Shapes of States Belgium: A Compact State Source: http://www.cyber.vt.edu/geog1014/topics/108States/shapes.html
Chapter Seven Political Geography Figure 7.4(b) Shapes of States Vietnam: An Elongated State Source: http://www.mapquest.com/atlas/main.edp?print=vietnam
Chapter Seven Political Geography Figure 7.4 Shapes of States South Africa: A Perforated State Source: http://www.cyber.vt.edu/geog1014/topics/108States/shape.html.
Chapter Seven Political Geography Figure 7.4(b) Shapes of States Indonesia: A Fragmented State Source: http://www.cyber.vt.edu/geog1014/topics/108States/shape.html.
Chapter Seven Political Geography Figure 7.4 Shapes of States Afghanistan: A Protruded State Source: http://www.mapquest.com/atlas/main.adp?print=afghanis
Chapter Seven Political Geography Figure 7.5 Volcanoes and Earthquakes Source: H. J. de Blij and Peter O. Miller, Physical Geography of the Global Environment, Second Edition (New York: John Wiley and Sons, 1996), p. 341.
Chapter Seven Political Geography Figure 7.6 Land-locked Countries Source: http//www.cyber.vt.edu/geog1014/topics/108States/neighbor.html
Chapter Seven Political Geography Figure 7.8 The Gobi Desert Source: http://chinapage.com/map/map.html
Chapter Seven Political Geography Figure 7.9 Cuba’s Proximity to the United States Source: Department of State and Department of Defense, The Challenge to Democracy in Latin America, Washington, DC, 1986, p. 5.
Chapter Seven Political Geography Figure 7.10 Map of the Roman Empire: Compare this map of the Roman Empire to that of the Arab Empire in Figure 7.11
Chapter Seven Political Geography Figure 7.11 The Arab Empire Source: The National Geographic Society, Peoples and Places of the Past, 1983, p. 137.
Chapter Seven Political Geography Figure 7.12 The Fertile Crescent: Some of the best farmland of the Fertile Crescent is in a narrow strip of land between the Tigris and Euphrates— today’s Iraq. Source: The National Geographic Society, Peoples and Places of the Past, 1983, p. 26.
Chapter Seven Political Geography Figure 7.13 Today’s Arab World Source: Cassel & Co., Ltd., 1975
Chapter Eight Nationalism and Regionalism Figure 8.1 Europe’s Industrial Production Zones: The Two Regional Bananas Source: John Newgouse, “Europe’s Rising Regionalism,” Foreign Affairs, January/February 1997, p. 70.
Chapter Eight Nationalism and Regionalism Figure 8.2 Spain’s Autonomous Regions Source: DeBlij and Muller, Realms, Regions, and Concepts, p. 90.
Chapter Nine Global Violence: Wars, Weapons and Terrorism Figure 9.1 Northern Spain and Southern France Highlighting the Basque Region Source: The Economist, March 18, 2000, p. 52.
Chapter Ten Global Justice: Women, Poverty and Human Rights Figure 10.1 Urban Poor by Region Source: UN Centre for Human Settlements (Habitat), State of the World Cities Report 2001, p. 18.pdf.
Chapter Ten Global Justice: Women, Poverty and Human Rights Figure 10.2 Incidence of Extreme Poverty: Under $1.00 a Day Source: http://www.cgiar.org/tac/meetings /meet0100/maps.pdf
Chapter Ten Global Justice: Women, Poverty and Human Rights Figure 10.3 Poorest Fifth’s Share of National Consumption Source: Organization for Economic Cooperation and Development (OECD) http://www.oecd.org/dac/Indicators/htm/map3.htm.
Chapter Ten Global Justice: Women, Poverty and Human Rights Figure 10.4 Ratio of Girls to Boys in Primary and Secondary Education (%) Source: http://www.developmentgoals.org/Gender_Equality.htm
Chapter Ten Global Justice: Women, Poverty and Human Rights Figure 10.5 Life Expectancy at Birth Source: http://www.worldbank.org/depweb/english/modules/social/life/t-map.html (OECD)
ChapterElevenInternational Political Economy I: The Advanced Industrial Countries Figure 11.1 Balance of Trade: Impact on a Country’s Reserves Source: Adapted from Joshua Goldstein, International Relations, Second Edition (New York: Addison Wesley Longman, 1997), p. 324.
ChapterElevenInternational Political Economy I: The Advanced Industrial Countries Figure 11.2 Degrees of Economic Policy Coordination
ChapterElevenInternational Political Economy I: The Advanced Industrial Countries Figure 11.3 Share of World Trade by Country Source: Data from Eurostat.
ChapterElevenInternational Political Economy I: The Advanced Industrial Countries Figure 11.4 The EU’s Main Trade Partners Source: Data from Eurostat.