Download

1 / 27
270 likes | 396 Views
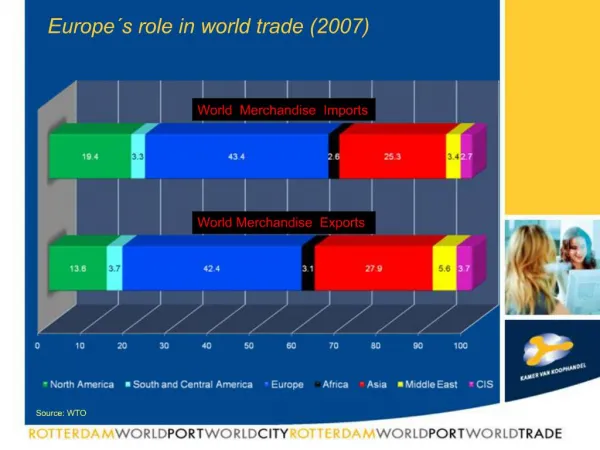
The world’s main fisheries countries 2007. Icelandic fish catches (1905-2009). 200 miles. 50 miles. 12 miles. 4 miles. Catch – average – 2007-2009. Focused on the sustainable utilization of all living marine resources.

E N D
Icelandic fish catches (1905-2009) 200 miles 50 miles 12 miles 4 miles
Catch – average – 2007-2009 • Focused on the sustainable utilization of all living marine resources
Combined shares of the 10 largest vessel operators,which were allocated catch quotas from the TAC in 1993 and 2009
The fishing fleet (number) – catch (Tonnes) and catch value (misk) 2009
Estimated number of employees in fishing and fish processing and percentage of the labour market in the period 2000 to 2009
Fishing 1997 - 2009 - EBITA and net profit (according to the annuity approach and 6% rate of return)
Between 200 and 250 fish processing companies • Fresh fish • Frozen fish • Salted Fish • Meal and fish oil • Approx. 97% of the total catch volume is exported
Demersal species – utilization of catches 2000, 2005 and 2009
Number of employees in fishing and fish processingandas a percentage of the labor market in the period 2000 to 2009
Fish processing - 1997 - 2009 - EBITA and net profit (according to the annuity approach and 6% rate of return) Percentage %
Percentage of total income coming from fishing and fish processing by region 2005
Export value 2009 by main fish species and further breakdown of cod exports by country Þorskur Cod Síld Herring Ýsa Haddock Karfi Redfish Ufsi Saithe Rækja Shrimp Loðna Capelin
Breakdown of the value of exported marine products by different processing categories 1997 - 2009
Breakdown of the value of marine product exports 2009 by trading areas
Fishing industry - EBITA and net profit 1997 – 2009 (according to the annuity approach and 6% rate of return) Persentage %
Marine products as a percentage of Icelandic exported goods, and of exported goods and services
Conclusions: • Focused on sustainable utilization of all living marine resources and economically efficient industry • Almost no subsidies • Average catch 2007 – 2009 ̃ 1.270 thousand tonnes • Relatively few fishing vessels and fish processing factories • Few fishermen ̃ 4.400 • Average catch pr. fisherman ̃̃ 300 tons • Profitable industry
Marine products/Seafood represents 27% of total export value of goods and services 42% of total export value of goods in 2009 • Fishing and fish processing contributed to 9% of GNP and employed 4.7% of the working population in 2009 • Of prime importance in the rural economy
THE FISHING INDUSTRY IS THE SINGLE MOST IMPORTANT EXPORT INDUSTRY IN ICELAND ITS DOMINATING EXPORT REVENUES ARE THEREFORE ONE OF THE FUNDAMENTAL FOUNDATIONS OF ICELANDIC SOCIETY • Even though the Icelandic economy is becoming more diverse it remains very dependent on the fisheries sector • It goes without saying that fishing is so important to the Icelandic economy that we have no other option than to manage our utilization of ocean resources in such a way that the sea will continue to support our livelihood in the future