Download
1 / 31
320 likes | 400 Views
Review of XTOD facility layout, FEL parameters, gas and solid attenuators, imaging detectors, and commissioning strategy. Evaluation of materials for beamline components. Validation of gas attenuator prototype design and analyses. Discussion on imaging systems for diagnostics.

E N D
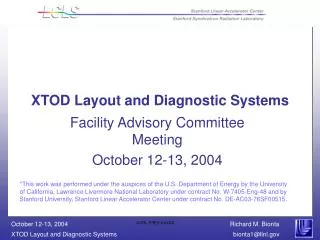
XTOD Layout and Diagnostic Systems Facility Advisory Committee Meeting October 12-13, 2004 *This work was performed under the auspices of the U.S. Department of Energy by the University of California, Lawrence Livermore National Laboratory under contract No. W-7405-Eng-48 and by Stanford University, Stanford Linear Accelerator Center under contract No. DE-AC03-76SF00515.
Outline • XTOD Layout • FEL parameters along Beam line • Gas and solid attenuators • Imaging detectors • Commissioning strategy • Conclusions
PPS 1.5 Scope: Front End Enclosure/ Near Experimental Hall 4' Muon shield NEH PPS Flipper Mirror Front End Enclosure Comissioning: Spectrometer, Total Energy Solid Attenuator Slit A 112 m Photon Beam Direct Imager Indirect Imager 83 m Slit B Gas Attenuator 13' Muon shield Fast close valve Electron Beam Electron Dump
Front End Diagnostics Schematic 112 m from end of undulator 83 m from end of undulator Front End Enclosure Near Hall Hutch 1 Calorimeter or spectrometer Gas Attenuator Imaging Systems Slits Slits Solid Attenuator Muon Shield Muon Shield
Dose to melt for various materials Melt dose ev/atom Dose in NEH Hutch 1 Z 8 keV 1 keV Beryllium 4 0.58 0.013 0.000 Diamond 6 2.13 0.062 0.002 Aluminum 13 0.20 0.072 0.058 Silicon 14 0.91 0.100 0.078 Copper 29 0.44 0.183 0.142 Molybdenum 42 1.24 0.993 0.649 Tin 50 0.14 1.873 1.292 Tungsten 74 1.06 1.316 1.341 Lead 82 0.14 2.016 2.042 Doses should be compared to dose needed to melt
Material suitability a strong function of photon energy Low Z materials such as Be, C, B4C and Si will survive at least > 1 shot in the NEH NEH Peak Fluence at entrance Fluence to Melt Melts in NEH
Gas and Solid Attenuators Gas Attenuator stage 2 Gas Attenuator stage 1 Gas Attenuator high pressure vesssel Slit B Autocad Solid Attenuator
Solid Be likely to survive at 88 m Be < 0.1 eV/atom for all photon energies
Pressure or thickness for 10-4 attenuation Use Gas Use Solids * 6 m of gas at pressure
Conductance – Intermediate Flow Modeled Knudsen Theory Tube Air 300 K d mm Fg gas factor (air Fg = 1) Molecualr Flow Conductance Intermediate Flow Conductance
Calculations for 6-Port configuration Gas flow to chamber 37.7 T-L/sec 2976 sccm Pump Speed 6 x 50 L/s Inter-connection Coupling L = 3 cm Hole size = 3 mm dia. 6-port configuration can maintain 10 Torr with 3 mm apertures
Bellows allow transverse positioning of opening in window Y stage Gate valve Bellows Be disk on gate valve X stage Y motion Be disk on gate valve transparent to high energy spontaneous, allows alignment of hole using cameras in NEH Hutch 1. Gate valve removes window when gas attenuator not in use.
Conductance – Intermediate Flow Modeled + Gas Attenuator Prototype Design and Analyses Will Validate Concepts
Gas attenuator issues • Pressure / Flow still very high (3 l/min) • Choice of gas • N2 ,Ar , Dry Air,CH-N… • Recirculation / Dumping gas • Normal operation • Unexpected release • Monitoring • Cu L monitor under study
NEH Hutch 1 Diagnostic systems Direct Imager Indirect Imager Comissioning Tank
Imaging Detector Tank Be Isolation valve Indirect Imager (Sees only a low intensity reflection) Direct Imager (Placed directly in beam) Turbo pump
Imaging detector head prototype CCD Camera Microscope Objective X-ray beam LSO or YAG:Ce crystal prism assembly
Direct imager issues • Vacuum Operation • Low Photon Energy Performance • 120 Hz Readout • Afterglow in LSO • High Energy Spontaneous Background • Damage threshold
Indirect Imager reflects small amount of FEL into camera, avoiding damage Be Mirror Reflectivity at 8 KeV Be Mirror 1 0.1 0.01 0.001 Be Mirror angle provides "gain" adjustment over several orders of magnitude and discriminates against high energy spontaneous background 0.0001
Indirect imager issues • Calibration • Mirror roughness • Tight camera geometry • Compton background • Vacuum q-2q mechanics • Making mirror thin enough for maximum transmission • Ceramic multilayers? • Use as an Imaging Monochrometer
Commissioning strategy • Start with Low Power Spontaneous • Saturate Direct Imagers, measure linearity with solid attenuators • Raise power, Measure linearity of Calorimeter and Indirect imager. Cross calibrate • Test Gas Attenuator • Raise Power, Look for FEL • in Direct Imager • Verify linearity with attenuators • switch to Indirect Imager if/when scintilator damages
Summary • Layout geometry is set. • Placement of Gas and solid attenuators enhances survivability of solids relaxing gas attenuator requirements. • Imaging detector concepts based on existing prototypes. Ready for detailed specification of scintillator, objective, … • Commissioning strategy is to bootstrap detectors / attenuators to higher fluences, checking linearity along the way.