Hierarchical Shape Classification Using Bayesian Aggregation
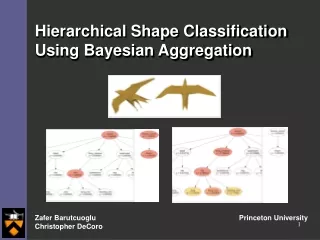
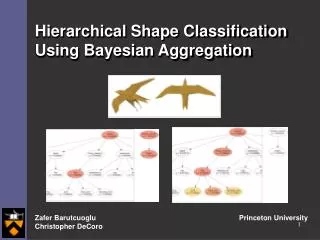
Hierarchical Shape Classification Using Bayesian Aggregation. Zafer Barutcuoglu Princeton University Christopher DeCoro. Shape Matching. Given two shapes, quantify the difference between them Useful for search and retrieval, image processing, etc.

Hierarchical Shape Classification Using Bayesian Aggregation
E N D
Presentation Transcript
Hierarchical Shape ClassificationUsing Bayesian Aggregation Zafer Barutcuoglu Princeton University Christopher DeCoro
Shape Matching • Given two shapes, quantify the difference between them • Useful for search and retrieval, image processing, etc. • Common approach is that of shape descriptors • Map arbitrary definition of shape into a representative vector • Define a distance measure (i.e Euclidean) to quantify similarity • Examples include: GEDT, SHD, REXT, etc. • A common application is classification • Given an example, and a set of classes, which class is most appropriate for that example? • Applicable to a large range of applications
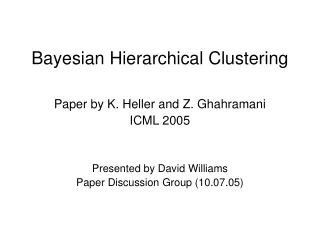
Hierarchical Classification • Given a hierarchical set of classes, • And a set of labeled examples for those classes • Predict the hierarchically-consistent classification of a novel example, using the hierarchy to improve performance. Example courtesy of “The Princeton Shape Benchmark”, P. Shilane et. al (2004)
Motivation • Given these, how can we predict classes for novel shapes? • Conventional algorithms don’t apply directly to hierarchies • Binary classification • Multi-class (one-of-M) classification • Using binary classification for each class can produce predictions which contradict with the hierarchy • Using multi-class classification over the leaf nodes loses information by ignoring the hierarchy
Other heirarchical classification methods, other domains • TO ZAFER: I need something here about background information, other methods, your method, etc. • Also, Szymon suggested a slide about conditional probabilities and bayes nets in general. Could you come up with something very simplified and direct that would fit with the rest of the presentation?
Motivation (Example) • Independent classifiers give an inconsistent prediction • Classified as bird, but not classified as flying creature • Also cause incorrect results • Not classified as flying bird • Incorrectly classified as dragon
Motivation (Example) • We can correct this using our Bayesian Aggregation method • Remove inconsistency at flying creature • Also improves results of classification • Stronger prediction of flying bird • No longer classifies as dragon
TOP-DOWN BOTTOM-UP animal animal YES YES biped biped NO NO human human YES YES Naïve Hierarchical Consistency INDEPENDENT animal YES biped NO human YES Unfair distribution ofresponsibility and correction
Our Method – Bayesian Aggregation • Evaluate individual classifiers for each class • Inconsistent predictions allowed • Any classification algorithm can be used (e.g. kNN) • Parallel evaluation • Bayesian aggregation of predictions • Inconsistencies resolved globally
Our Method - Implementation • Shape descriptor: Spherical Harmonic Descriptor* • Converts shape into 512-element vector • Compared using Euclidean distance • Binary classifier: k-Nearest Neighbors • Finds the k nearest labeled training examples • Novel example assigned to most common class • Simple to implement, yet flexible * “Rotation Invariant Spherical Harmonic Representation of 3D Shape Descriptors” M. Kazhdan, et. al (2003)
g1 animal y1 g2 biped y2 g3 flying creature y3 g4 superman y4 A Bayesian Framework Given predictions g1...gN from kNN, find most likely true labels y1...yN
Classifier Output Likelihoods P(y1...yN | g1...gN) = αP(g1...gN | y1...yN) P(y1...yN) • Conditional independence assumption • Classifiers outputs depend only on their true labels • Given its true label, an output is conditionally independent of all other labels and outputs P(g1...gN | y1...yN) = i P(gi | yi)
Estimating P(gi | yi) The Confusion Matrix obtained using cross-validation Predicted negative Predicted positive Negative examples Positive examples e.g. P(g=0 | y=0) ≈ #(g=0,y=0) / [ #(g=0,y=0) + #(g=1,y=0) ]
Hierarchical Class Priors P(y1...yN | g1...gN) = αP(g1...gN | y1...yN)P(y1...yN) • Hierarchical dependency model • Class prior depends only on children P(y1...yN) = i P(yi | ychildren(i)) • Enforces hierarchical consistency • The probability of an inconsistent assignment is 0 • Bayesian inference will not allow inconsistency
g1 g2 g3 g4 Conditional Probabilities • P(yi | ychildren(i)) • Inferred from known labeled examples • P(gi | yi) • Inferred by validation on held-out data y1 y2 y3 y4 • We can now apply Bayesian inference algorithms • Particular algorithm independent of our method • Results in globally consistent predictions • Uses information present in hierarchy to improve predictions
Applying Bayesian Aggregation • Training phase produces Bayes Network • From hierarchy and training set, train classifiers • Use cross-validation to generate conditional probabilities • Use probabilities to create bayes net • Test phase give probabilities for novel examples • For a novel example, apply classifiers • Use classifier outputs and existing bayes net to infer probability of membership in each class Hierarchy Classifiers Cross-validation Bayes Net Training Set Test Example Classifiers Bayes Net Class Probabilities
Experimental Results • 2-fold cross-validation on each class using kNN • Area Under the ROC Curve (AUC) for evaluation • Real-valued predictor can be thresholded arbitrarily • Probability that pos. example is predicted over a neg. example • 169 of 170 classes were improved by our method • Average AUC = +0.137 (+19% of old AUC) • Old AUC = .7004 (27 had AUC of 0.5, random guessing)
AUC Changes • 169 of 170 classes were improved by our method • Average AUC = +0.137 (+19% of old AUC) • Old AUC = .7004 (27 had AUC of 0.5, random guessing)