Download
1 / 23
230 likes | 348 Views
FACULDADE DE MEDICINA Universidade de Lisboa. Energy Metabolism and Neuronal Activity: A Physiological Model for Brain Imaging. Ana Rita Laceiras Gafaniz 2 de Dezembro de 2010. Introduction.

E N D
FACULDADE DE MEDICINA Universidade de Lisboa Energy Metabolism and Neuronal Activity: A Physiological Model for Brain Imaging Ana Rita LaceirasGafaniz 2 de Dezembro de 2010
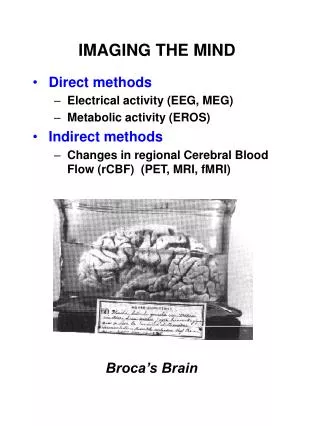
Introduction • Functional Magnetic Resonance Imaging (fMRI) is a widelyusedmethod to detecttheactivated brain regions due to a stimulus application. • TheBlood-Oxygenation-Level-Dependent(BOLD) signal is based on the well-establishedcorrelationbetween neuronal activity, energy metabolism and haemodynamics. • The BOLD effectissmalland data isnoisy, turningthisinferenceproblem a difficulttask • An accurate knowledgeof the Haemodynamic Response Function (HRF) to a localized neural stimulus is critical, in order to interpret the fMRIdata confidently.
Introduction: Model Design for the HRF Na,K-ATPase
Motivation • A Physiologically-Based Haemodynamic linear model for the HRF (Afonso et al (2007)) • the Brain Group modulates the brain cells CMRO2 and the vascular demand; • the Vessel Group modulates the summed effect of CBV and CBF vascular changes on the oxyHb/deoxyHb rate in and around blood vessels; • the Control Group for the systemic negative feedback control over vasodilation.
Objectives • Obtain a practical, tractable and simultaneously accurate mathematical model to describe the neuro-metabolic and neuro-vascular couplings that lead to the BOLD effect. • A physiologically-based lineal model describingtherelationbetween the neuronal electrical activity and the ATP dynamics is proposed.
TheNeuro-MetabolicModel:Overview a) Na/K-ATPase; b)K+ leak channels; c)Na+ leak channels; d)Na+ Voltage Gated Channels; e) K+ Voltage Gated Channels; f) Mitochondria g) Cellular Membrane
SodiumandPotassium Dynamics:OrdinaryDifferentialEquations Iontransportassociatedwiththe ElectricalActivity Electrochemicalgradient: Concentrationgradient Na/K-Pump: Electricfield
SodiumandPotassium Dynamics:Neuronal ElectricalActivity r(t) depolarisation Hodgkin-Huxley hyperpolarisation repolarisation
Neuronal Electrical Activity and ATP Consumption ATP Consumption Rate: ATP Consumption:
TheMitochondria • The mitochondria acts as a regulator, from a Control Theory perspective • With a type-I system, the steady-state error to the step is zero and it is finite to the ramp.
OverallNeuro-MetabolicModel:Neuronal ElectricalActivityand ATP Dynamics • The dynamic evolution of the intracellular concentration of ATP along the time results from the contribution of • the ATP consumption, due to the Na,K-ATPase activity • the ATP synthesis, by the mitochondrial activity
CoefficientsEstimation Themodelparameterswere obtained from the literature, or estimated when they were not available ATP(s) coefficients Na(s) and K(s) coefficients
Time constant Consistent with experimental work for mammalian CNS neurons ResultsSustainedActivationandRepetitiveActivation Comparison with the results published by Aubert & Costalat (2002) (in blue)
ResultsSustainedActivationandRepetitiveActivation ATP dynamics: comparison with the results published by Aubert & Costalat (2002) (in blue) Time constant
Pole-Zero (PZ) Map PZ fromthe Na/K-ATPase: PZ fromthemitochondria:
OverallTransferFunction • p1 mainly depends on ρ, the Na/K-ATPaseactivity time constant • p3derives from the time constant, τ, for ATP production bythemitochondria Simplification using the Taylor Series Expansion
Frequency response Response to a 100Hz impulse train of spikes
Conclusions and Future Work • A physiologically-based model representing the ATP dynamics as a function of the neuronal electrical activity was proposed • A second order linear system with no zeros • Model parameters tuned with data obtained from the literature. • Validation with real data • IncorporatetheNeuro-MetabolicModelin a more general model describing the Haemodynamic Response Function
References • D. M. Afonso, J. M. Sanches, and M. H. Lauterbach, “Neural physiological modeling towards a hemodynamic response function for fMRI,” in 29th Annual International Conference of the IEEE Engineering in Medicine and Biology Society, EMBC 2007. IEEE International Conference of the Engineering in Medicine and Biology Society (EMBS), August 2007. • A. Aubert and R. Costalat, “A model of the coupling between electrical activity, metabolism, and hemodynamics: Application to the interpretation of functional neuroimaging,” Neuroimage, vol. 17, pp. 1162–1181, 2002. • S. Ogawa, T. M. Lee, A. R. Kay, and D.W. Tank, “Brain magnetic resonance imaging with contrast dependent on blood oxygenation,” in Proceedings of the National Academy of Sciences, S. U. H. Press, Ed., vol. 87. National Academy of Sciences, September 1990, pp. 9868–9872. • J. Malmivuo and R. Plonsey, Bioelectromagnetism, Principles and Applications of Bioelectric and Biomagnetic Fields. Oxford University Press, 1995. • M. F. Bear, B. W. Connors, and M. A. Paradiso, Neuroscience: Exploring the Brain. Williams & Wilkins, 1996. • A. L. Hodgkin and A. F. Huxley, “A quantitative description of membrane current and and its application to conduction and excitation in nerve,” Journal of Physiology (London), vol. 117, pp. 500–544, 1952. • M. D. Mann, “Control systems and homeostasis,” The Nervous System In Action, accessed at July 20, 2010. [Online]. Available: http://www.unmc.edu/physiology/Mann/mann2.html • D. Attwell and S. B. Laughlin, “An energy budget for signaling in the grey matter of the brain,” Journal of Cerebral Blood Flow & Metabolism, vol. 21, pp. 1133–1145, 2001.
Aknowledgements • Prof. João Sanches • Prof. Patrícia Figueiredo • Prof. Fernando Lopes da Silva • Prof. João Miranda Lemos • Nuno Santos • André Gomes • David Afonso