Download
1 / 10
100 likes | 126 Views
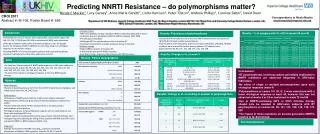
Explore the non-inferiority and tolerability of RPV/FTC/TDF compared to EFV/FTC/TDF in ARV-naïve HIV patients. Results show RPV/FTC/TDF's superior efficacy for patients with baseline HIV-1 RNA ≤100,000 c/mL. RPV/FTC/TDF demonstrated improved tolerability with lower rates of nervous system and psychiatric adverse events. Both treatments had similar virologic efficacy.

E N D
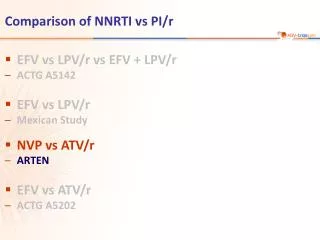
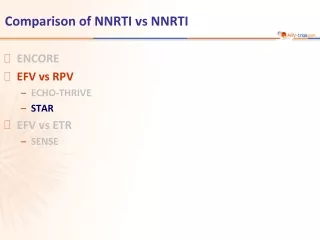
Comparison of NNRTI vs NNRTI • ENCORE • EFV vs RPV • ECHO-THRIVE • STAR • EFV vs ETR • SENSE
STAR Study: RPV/FTC/TDF vs EFV/FTC/TDF • Design Randomisation* 1 : 1 Open-label W48 W96 > 18 years ARV-naïve HIV RNA > 2,500 c/mL Any CD4 cell count eGFR > 50 mL/min Sensitivity to EFV, FTC and TDF on genotype No RPV resistance mutations** N = 394 N = 392 Concomitant use of proton pump inhibitors was not allowed * Randomisation was stratified by HIV RNA (< or > 100,000 c/mL) ** K101E/P, E138A/G/K/Q/R, Y181C/I/V, H221Y • Objective • Non inferiority of RPV/FTC/TDF at W48: % HIV RNA < 50 c/mL by intention to treat, snapshot analysis (1-sided significance level of 2.5%, lower margin of the 97.5% CI for the difference = -12%, 95% power) STAR Cohen C. AIDS 2014;28:989-97
STAR Study: RPV/FTC/TDF vs EFV/FTC/TDF Baseline characteristics and patient disposition STAR Cohen C. AIDS 2014;28:989-97
STAR Study: RPV/FTC/TDF vs EFV/FTC/TDF Response to treatment (HIV RNA < 50 c/mL) at week 48 RPV/FTC/TDF EFV/FTC/TDF % Primary analysis 100 88.8 85.3 85.8 79.9 81.6 81.6 79.6 81.7 75 50 25 0 ITT, TLOVR ITT, snapshot ITT snapshot, by baseline HIV-1 RNA Adjusted difference (95% CI)= 4.1% (-1.1 ; 9.2) > 100,000 c/mL < 100,000 c/mL Adjusted difference (95% CI)= 5.9% (0.6 ; 11.2) Difference (95% CI)= 7.2% (1.1 ; 13.4) Difference (95% CI)= -1.8% (-11.1 ; 7.5) Median CD4/mm3 increase at W48 : + 200 RPV/FTC/TDF vs + 191 EFV/FTC/TDF STAR Cohen C. AIDS 2014;28:989-97
STAR Study: RPV/FTC/TDF vs EFV/FTC/TDF • Resistance analysis through week 48 * HIV RNA > 400 c/mL and suboptimal virologic response (confirmed < 1 log10 c/mL decrease in HIV RNA at W8) virologic rebound (2 consecutive visits with HIV RNA > 50 c/mL after achieving < 50 c/mL, 2 consecutive visits with > 1 log10 c/mL increase in HIV RNA from the nadir) or HIV RNA > 400 c/mL at W48 or last visit STAR Cohen C. AIDS 2014;28:989-97
STAR Study: RPV/FTC/TDF vs EFV/FTC/TDF • Safety through week 48 • Treatment-emergent adverse events of specific interest in > 5% in either arm STAR Cohen C. AIDS 2014;28:989-97
STAR Study: RPV/FTC/TDF vs EFV/FTC/TDF Mean changes in fasting lipids (mg/dL) at week 48 RPV/FTC/TDF EFV/FTC/TDF P<0.001 for all between treatment groups using ANOVA Mean baseline values (mg/dL) 164 163 104 103 121 129 44 44 Change in total cholesterol/HDL-cholesterol at week 48 was -0.2 in both arms STAR Cohen C. AIDS 2014;28:989-97
Conclusion at week 48 In treatment-naive HIV-infected patients, RPV/FTC/TDF demonstrated non inferior efficacy and improved tolerability compared with EFV/FTC/TDF, at week 48 RPV/FTC/TDF was statistically significant superiority in efficacy for patients with baseline HIV-1 RNA ≤ 100,000 c/mL Virologic efficacy was similar for patients with baseline HIV-1 RNA > 100,000 c/mL More discontinuations due to adverse events in the EFV/FTC/TDF arm Significantly lower rates of nervous system and psychiatric adverse events in the RPV/FTC/TDF arm than in the EFV/FTC/TDF arm Differences primarily due to dizziness and abnormal dreams Virologic failures rates were similar between the 2 treatment arms A greater proportion of patients in the RPV/FTC/TDF arm developed primary emergent NRTI or NNRTI resistance mutations at virologic failure STAR Study: RPV/FTC/TDF vs EFV/FTC/TDF STAR Cohen C. AIDS 2014;28:989-97
STAR Study: RPV/FTC/TDF vs EFV/FTC/TDF Response to treatment (HIV RNA < 50 c/mL) at week 96 RPV/FTC/TDF at W48 EFV/FTC/TDF at W48 % RPV/FTC/TDF at W96 EFV/FTC/TDF at W96 100 FavorsEFV/FTC/TDF FavorsRPV/FTC/TDF 89 82 82 80 79 76 75 80 71 HIV RNA at baseline 60 < 100,000 c/mL 1.1 7.2 13.4 W48 7.6 15.1 40 0.2 W96 P=0.046 > 100,000 c/mL 20 -11.1 -1.8 7.5 W48 1.5 11.6 -8.7 W96 P=0.78 0 231/260 204/250 205/260 178/250 107/134 116/142 102/134 106/142 -12% 0 12% < 100,000 c/mL > 100,000 c/mL Baseline HIV RNA STAR Cohen C. IAC 2014 Melbourne, Abs. WEPE064
STAR Study: RPV/FTC/TDF vs EFV/FTC/TDF Resistance analysis at week 96 STAR Cohen C. IAC 2014 Melbourne, Abs. WEPE064