Download
1 / 9
100 likes | 279 Views
Comparing STEREO heliographic maps to GONG far-side imaging. William Thompson Adnet Systems, Inc. NASA/GSFC. STEREO Heliographic Maps. The STEREO spacecraft are now separated by >135°. Can see more than 85% of the solar sphere.

E N D
Comparing STEREO heliographic maps to GONG far-side imaging William Thompson Adnet Systems, Inc. NASA/GSFC
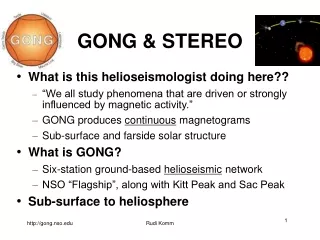
STEREO Heliographic Maps • The STEREO spacecraft are now separated by >135°. Can see more than 85% of the solar sphere. • The full Sun will be visible beginning in February 2011 (when combined with SDO). • Can use the STEREO 195Å maps to validate the farside imaging produced by helioseismology.
GONG Calibrated Farside Maps • GONG project provides “calibrated” maps with candidate regions of 70% or higher marked in red. • Calibrated maps start on 17 August 2009, and continue through present. • Chose to compare marked events with STEREO EUVI 195Å maps (ssc_euvi_synoptic.pro).
Event Classification • Examined 70 candidate events between 21 August 2009 and 17 February 2010: • 37 events could be associated with active regions visible in STEREO (true positive) • 8 events could not be associated with any active regions (false positive) • 25 events occurred in the region unobserved by STEREO, and could not be identified with any EUV plage areas visible on other dates (unverified) • GONG events in the “blind spot” were counted as matches if the active region was visible in previous or following days. • This introduces a bias towards positive results which will be removed once STEREO sees the entire Sun.
Example of True Positive Match Active Region 11026 Example of False Positive Match STEREO 195Å GONG prediction
Statistics • Histograms of the GONG probability values for the three categories of events. • Distributions for true positive and unverified events are similar. • Distribution for false positive events is somewhat lower. True positive Unverified False positive
Time History (1) • Average number of predictions per day, smoothed over 81 days. • Number of true positives starts to rise at the end of 2009. • The unverified rate drops at the same time. True positive Unverified False positive
Time History (2) • Same data as percentages. • Also shown is the expected percentage of unverified events. • Too many unverified events are seen in 2009 • Too few unverified events in 2010 are due to already discussed bias True positive Unverified False positive
Conclusions • During 2009, about 35–40% of the GONG predictions could be verified as active regions by STEREO. This percentage increased as solar activity picked up in 2010. • About 10% of the GONG predictions were determined to be false. • The percentage of unverified predictions during 2009 was larger than that consistent with chance, suggesting that the false prediction rate is higher than 10%, and that GONG preferentially predicts sunspots near the farside center. • The number of unverified predictions dropped as solar activity increased. This suggests that the presence of sunspots tends to suppress false predictions.