NGC 4696
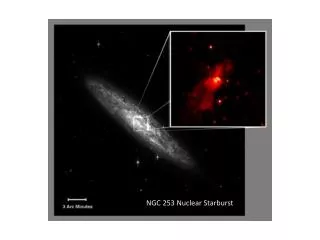
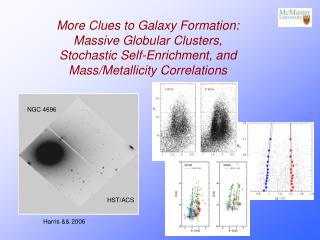
More Clues to Galaxy Formation: Massive Globular Clusters, Stochastic Self-Enrichment, and Mass/Metallicity Correlations. NGC 4696. HST/ACS. Harris && 2006. Pregalactic dwarf. Proto-GCs. Young massive star clusters (YMCs) forming at ~10 5 M 0 in starburst dwarfs today.

NGC 4696
E N D
Presentation Transcript
More Clues to Galaxy Formation: Massive Globular Clusters, Stochastic Self-Enrichment, and Mass/Metallicity Correlations NGC 4696 HST/ACS Harris && 2006
Pregalactic dwarf Proto-GCs Young massive star clusters (YMCs) forming at ~105 M0 in starburst dwarfs today Starburst dwarf NGC 5253 (ESO/HST)
Bimodal or not? Harris && 2008 Harris && 2006
Disagreements ahead -- Bimodal or not? Harris && 2008 Harris && 2006
Serious questions persist! Is this effect caused by --- (1) A gradual shift of the blue sequence to redder color at higher luminosity? (Mass/Metallicity relation) (2) The disappearance of bimodality altogether at the highest masses? (Threshold enrichment effect) (3) An artifact of photometric measurement procedures? (i.e. not real) If it’s a true, physical MMR then Z ~ M1/2 at high mass, and it may smoothly connect upward to the UCD regime. Does it continue to low mass? Why no red-sequence MMR? Is it present in all galaxies? What is its astrophysical origin?
w Cen (Villanova && 2007) - Multiple populations within a single GC - Different scaling of size vs. mass Evstigneeva et al. 2008 The systematic properties of globular clusters begin to change for M > 2 x 10⁶ M0 … - Appearance of the MMR
Can be helped (partially) by constructing composite samples; e.g grouping Virgo Cluster Survey galaxies into 4 luminosity groups (Mieske && 2006) or combining several supergiants (Harris && 2006) But if amplitude of MMR differs from one galaxy to another, net effect will be diluted in composite samples The basic feature of bimodality is a first-order and (probably) universal effect. The MMR is a second-order effect and harder to trace. Though new, much confusion already exists: Category 1:MMR is present and measurable M87, NGC 1399, several other BCGs and gE’s Category 2:MMR is not present M49; any others? Category 3:presence of MMR not decidable; GC sample too small or does not extend to high enough luminosity Milky Way; M31; dwarf galaxies; most spirals; GC-poor E’s
Most galaxies do not have clusters in the 106 – 107 M0 range 1: strong MMR 2: no MMR 3: Not decidable Milky Way GCs MV [Fe/H]
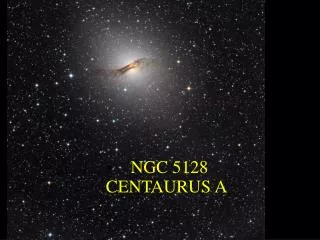
First, let’s get the measurements straightened out. NGC 5128: d=3.8 Mpc Globular clusters are easily resolved at <1’’ seeing Photometry must account for individually different scale sizes GC profile as seen on image = PSF Intrinsic GC profile rh ~ 1 – 5 parsecs; averages 3 pc 0.3” width
NGC 3311/3309 (A1060) d = 50 Mpc 2 rh ~ 6 pc 0.025” fwhm(PSF) = 0.5” starlike! psf-fitting photometry is fine Several regimes determined by distance; no single photometric method is suitable for all regimes Gemini-S + GMOS, Wehner & Harris
Aperture photometry r(ap) adjusted for D PSF-fitting photometry HST/ACS imaging of GCs around 6 central supergiants in Abell-type clusters (Harris et al. 2006, 2008) (B,I) bandpasses metallicity-sensitive Thousands of GCs per galaxy, thus good statistical samples and big luminosity (mass) range 4 distinguishable regimes: compare fwhm of stellar PSF with intrinsic cluster size D (= 2 rh),half-light diameter Well resolved: D >> fwhm(PSF) Partially resolved: D ~ fwhm Marginally resolved: D ~ 0.1 – 0.3 fwhm Unresolved (starlike): D < 0.1 fwhm All this is subject to S/N considerations …
HST/ACS Imaging program for BCGs NGC 1407 Eridanus d=23 Mpc MV = -22.35 NGC 3258 Antlia 41 Mpc -21.87 NGC 3268 Antlia 41 Mpc -21.96 NGC 3348 CfA69 41 Mpc -22.13 NGC 4696 Centaurus 42 Mpc -23.31 NGC 7626 Pegasus I 49 Mpc -22.58 (M87 Virgo 16 Mpc -22.4) (Partial list – biggest GCSs out of 12 studied) D = 6 pc at d ~ 40 Mpc half-light profile width ~ 0.03” compare PSF fwhm = 0.1” marginally resolved
Photometric technique: • Uniform catalog of detected objects with DAOPHOT • Construct PSF from average of many bright starlike objects • For each individual source, convolve PSF with “King30” model GC profile and vary D(model) to obtain best match (ISHAPE; Larsen 1999) • finally, use fixed-aperture photometry corrected for profile width to obtain final magnitude in each band ISHAPE sample fits 1 px = 0.05” HST/ACS S/N=441 fwhm a=1.3 px b/a = 0.91 S/N=24 fwhm a=0.82 px b/a = 0.50 S/N=108 starlike
Simulations show that the systematically correct intrinsic D (FWHM of GC profile) is returned for D > 0.1 (PSF) (transition boundary from unresolved to marginally resolved) Our regime Growth curves for simulated GC profiles convolved with PSF ISHAPE solve for best-fit D Measure magnitude through 2.5-px aperture, corrected back to the growth curve for a starlike profile
S/N > 50 !! More tests … Measured size a not affected by modestly elliptical shape b/a, q returned correctly for a > 0.1 PSF
Full, profile-corrected aperture photometry for 6 supergiant ellipticals Previous PSF-fitting data (Harris && 2006) • Trend lines: • blue and red? • linear slope? or top end only? • how steep? N=12000 brighter than MI = -8. Largest sample in existence!
Red sequence: no trend Blue sequence: gradual changeover to MMR toward higher mass Z ~ M0.3+-0.1 RMIX fits of bimodal gaussians within selected magnitude intervals: forces two modes into the solution, but (a) less affected by field contamination, (b) avoids the strong assumption imposed by a ‘linear fit’
Trends (?) versus galactocentric distance and metallicity: projection effects, or intrinsic? Low-metallicity GCs average larger size at any galactocentric zone
The MMR is not due to an unaccounted-for size-mass relation.
Input assumptions to self-enrichment model: SNe from >8 M0 stars enrich lower-mass stars while still in formation Salpeter IMF 0.3 100 M0 and SF efficiency f* ~ 0.3 Woosley/Weaver SN yields, and fraction fZ of heavy elements retained in GMC and thus What is responsible for the metallicity distribution function (MDF)? Bailin & Harris 2008 Is a proto-GC - PRE-enriched from the surrounding GMC gas? - internally SELF-enriched by its own SNe within the first few Myr? - stochastic? (can self-enrichment be responsible for the internal dispersion of the MDF?)
Pre-enrichment level for fZ = 0.08 Internal dispersion of MDF due to statistical variation in NSN NSN ~ 1 per 100 M0 Stochastic self-enrichment fails to explain the MDF dispersion at any cluster mass higher than 104 M0
Proto-GC = truncated isothermal sphere logarithmic potential F(R). All SNe go off while PGC is still highly gaseous; all ejected energy absorbed and thermalized. Gas will leave if outside an “escape radius” defined by total energy > potential energy at edge of cloud. Ejecta become efficiently retained at a characteristic mass (after star formation) Two additional, major factors to add: - reff ~ M1/2 at high mass - fZ is a strong function of M(init) and thus reff as well
Match to BCG data for 6 galaxies • pre-enrichment of each “mode” (blue, red) tuned to match mean color • self-enrichment drives shape of mean MDF at high mass Combined effects of pre-enrichment, self-enrichment, and mass/radius relation
Wehner && 2008 • Basic features of the model: • No MMR for cluster masses < ~106 M0 (i.e., sequences vertical) • Very metal-poor, very massive GCs should be rare (anywhere) • blue and red sequence converge at high-mass end • Similar red-sequence MMR should exist at top end, but smaller amplitude • Internal dispersion and mean metallicity of each mode driven by pre-enrichment