Download
1 / 20
200 likes | 340 Views
Results of Conductor Testing in SULTAN: A Review. R. Wesche, M. Bagnasco, P. Bruzzone, M. Calvi, F. Cau, R. Herzog, C. Marinucci, B. Stepanov EPFL – CRPP, Switzerland. Rainer Wesche, WAMSDO Workshop, CERN, May 19-23, 2008. Introduction.

E N D
Results of Conductor Testing in SULTAN:A Review R. Wesche, M. Bagnasco, P. Bruzzone, M. Calvi, F. Cau, R. Herzog, C. Marinucci, B. Stepanov EPFL – CRPP, Switzerland Rainer Wesche, WAMSDO Workshop, CERN, May 19-23, 2008
Introduction In the last few years a large number of NbTi and Nb3Sn sub- as well as full-size cable-in-conduit (CIC) conductors were tested in the SULTAN facility. For many of these conductors, the strand critical current was measured separately as a function of field, temperature and strain. Using strand scaling relations (interpolation) and the measured strand data the “potential” DC performance of various CIC conductors has been estimated. In the estimation of the “potential” Tcs or Ic it has been supposed that the current distribution is uniform. The performance of the SULTAN samples is compared to this “potential” performance. Rainer Wesche, WAMSDO Workshop, CERN, May 19-23, 2008
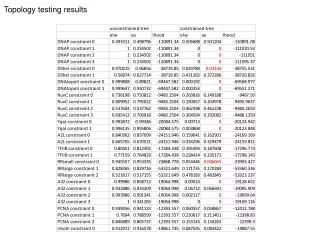
He L: T11/T11a R: T12/T12a L: T9/T9a R: T10/T10a L: T7/T7a R: T8/T8a L: T5/T5a R: T6/T6a L: T3/T3a R: T4/T4a He SULTAN Samples Sub-size (hairpin) samples (No bottom joint) Full-size samples (With bottom joint) Rainer Wesche, WAMSDO Workshop, CERN, May 19-23, 2008
NbTi CIC Conductors NbTi #3 PFIS R LCJ Rainer Wesche, WAMSDO Workshop, CERN, May 19-23, 2008
Results of NbTi Sub-size Conductors I 9 kA 3% 10% 5% 7% 6% 4% 4% Measured Tcs values of NbTi hairpin conductors are very close to the “potential” Tcs. Deviations are of the order of 0.1 K. Cyclic loading does not affect the Tcs. 4 out of 5 conductors reach more than 90% of the “potential” Ic. NbTi #4 (wraps): 80% of “potential” Ic. ncable nstrand Rainer Wesche, WAMSDO Workshop, CERN, May 19-23, 2008
Results of NbTi Full-size Conductors 11% 13% 11% Measured Tcs values of NbTi full-size conductors are in very good agreement with the “potential” Tcs. Deviations are typically less than 0.1 K. All NbTi full-size conductors reach more than 90% of the “potential” Ic. Rainer Wesche, WAMSDO Workshop, CERN, May 19-23, 2008
Summary NbTi CIC Conductors • No significant cyclic load degradation. • In 4 out of 8 conductors more than 95% of the “potential” Ic is reached. • In 7 out of 8 conductors more than 90% of the “potential” Ic is reached. • In NbTi #4 (wraps) only 80% of the “potential” Ic is reached. • The deviations from the potential Ic include: • Accuracy of the strand measurements (Strand B, 0.02 K, 5% in Ic @ 6 K, 6 T). • Errors in strand scaling parameters (Ictypically below 8%, 6 T underestimation, 6 T overestimation of Ic). • Accuracy of the SULTAN temperature measurements before 2006 • (0.05 K, NbTi #3, 10% in Ic @ 6 K, 6 T). • Uncertainty in the “potential” Ic, which is based on a completely uniform current distribution and the assumption that each strand is found with the same probability at any position in the cable cross-section. Rainer Wesche, WAMSDO Workshop, CERN, May 19-23, 2008
Nb3Sn Sub-size CIC Conductors Rainer Wesche, WAMSDO Workshop, CERN, May 19-23, 2008
Dipole Pre-Prototype Measured Tcs values are close to the “potential” Tcs for = -0.61%. Cable n values above 20 for Ic values higher than 20 kA. All measured Ic values are close to the “potential” Ic for = -0.61%(no BI dependent extra strain required). Negligible cyclic load degradation. Rainer Wesche, WAMSDO Workshop, CERN, May 19-23, 2008
PITSAM 1 In the further considerations a strain of -0.65% is used to calculate the “potential” Tcs or Ic values. Measured Tcs values are close to the “potential” Tcs for = -0.65%. Again the cable Ic is close to the “potential” Ic for a single value. Rainer Wesche, WAMSDO Workshop, CERN, May 19-23, 2008
VAC Nb3Sn: Triplet versus Braid n values 10.5 T, 11.5 B Braid results are closer to the “potential” Tcs and Ic values. Moreover, the triplet CICC shows reduced performance after cyclic loading. Braid: I 15 kA Iccable: 80-90% Icpot Triplet: I 15 kA Iccable: 75% Icpot (after cyclic loading) : -0.75 to -0.90% would fit the data Rainer Wesche, WAMSDO Workshop, CERN, May 19-23, 2008
Effect of Load and Thermal Cycles Considerable performance loss of PITSAM 2 (square conductor) during cyclic loading. CICC half length with long twist pitches shows better performance and less sensitivity to load and thermal cycles. Behavior of PITSAM 3 (aspect ratio: 1.7) is comparable to that of PITSAM 5 long. Rainer Wesche, WAMSDO Workshop, CERN, May 19-23, 2008
Summary: Nb3Sn Sub-size CIC Conductors Pre-Prototype and PITSAM 1 reach the “potential” performance. VAC braid, PITSAM 3 and PITSAM 5L reach 80% of the “potential” performance. VAC Triplet, PITSAM 2: 70% PITSAM 5S: 55% Pre-Prototype and PITSAM 1 are characterized by good performance and negligible cyclic load degradation. The complete data set can be described by a single value of strain. A rectangular shape seems to be advantageous. Low performance is accompanied by sensitivity to cyclic and thermal loads. Rainer Wesche, WAMSDO Workshop, CERN, May 19-23, 2008
Nb3Sn Full-size CIC Conductors Rainer Wesche, WAMSDO Workshop, CERN, May 19-23, 2008
TFAS Nb3Sn Full-Size Conductors TFAS OST shows the most pronounced reduction of Tcs after cyclic loading. Smaller effects for TFAS EAS and OKSC. Nearly unchanged values for TFAS OCSI. Ic values after cyclic loading reach 80% of the “potential” Ic. TFAS OKSC after cyclic loading Ic 0.7 Icpotential Rainer Wesche, WAMSDO Workshop, CERN, May 19-23, 2008
TFPRO 1 & 2 Both legs of TFPRO1 are close to the “potential” Tcs. The data suggest that the strain is close to -0.6%. Cyclic load effects are negligible. The Tcs values measured for TFPRO2 OST2 are far above the “potential” Tcs. No evidence for cyclic load degradation. TFPRO2 OST1 showed a pronounced cyclic load degradation. The lowest Tcs value in the plot corresponds to 65% of the “potential” Ic. Rainer Wesche, WAMSDO Workshop, CERN, May 19-23, 2008
JATF 1, 2 & 3 JATF1: Negligible cyclic load effects. Measured Tcs values slightly below the “potential” Tcs. Both the Hitachi and the Mitsubishi leg reach more than 80% of the “potential” Ic. JATF 2 results are in line with the test of JATF 1. Hitachi: 85% of Icpot Mitsubishi: 90% of Icpot JATF 3: Tcs of both legs is well below the “potential” Tcs. Evidence for cyclic load degradation. Ic of both legs 70% of Icpot (after cyclic loading) Rainer Wesche, WAMSDO Workshop, CERN, May 19-23, 2008
Summary: Nb3Sn Full-size CIC Conductors TFAS1-EAS, OST & OKSC: Ratio depends on current. Extra strain or degradation and lower strain. TFPRO1: Both legs are close to the Icpot. Strain is lower than -0.65%. TFPRO2-OST2: Data are consistent with -0.45%. Both legs of TFPRO1 and TFPRO2-OST2 reach Icpot. JATF 1 & 2 Hitachi as well as Mitsubishi are close to Icpot. All 4 TFAS legs, TFPRO2-OST1, JATF3-F & J, and KOTF-L & R: Iccable is below Icpot. Rainer Wesche, WAMSDO Workshop, CERN, May 19-23, 2008
ITER TF Conductors Statistics Tcs 6.5 K 3 CIC conductors 6 K Tcs 6.5 K 4 CIC conductors 5.5 K Tcs 6 K 5 CIC conductors Tcs 5.5 K 4 CIC conductors Rainer Wesche, WAMSDO Workshop, CERN, May 19-23, 2008
Summary • For NbTi sub- and full-size conductors, a good agreement of measured Tcs (Ic) with the “potential” values has been found. No evidence for cyclic load degradation in the two tested sub-size conductors. • Nb3Sn sub-size: Dipole pre-prototype and PITSAM 1 show excellent agreement with “potential” Tcs and Ic. Data can be described without a load-dependent extra strain. These two conductors are not sensitive to cyclic loading. • VAC triplet, PITSAM 2, PITSAM 5 short showed reduced performance after cyclic loading and/or thermal cycles. Tcs and Ic are below the “potential” values. • Nb3Sn full-size: For TFAS1-EAS & OST, TFAS2-OCSI & OKSC, TFPRO2-OST1, JATF3 Furukawa & JASTEC and KOTF, the measured Tcs values (Ic) are below the “potential” values. Most of these conductors are sensitive to cyclic loading. • “Potential” values have been reached in TFPRO1-EAS1 & 2, TFPRO2-OST2. JATF1 & 2 (Hitachi and Mitsubishi) are close to the potential values. • ITER conductors: 7 out of 16 reach Tcs values of 6 K or above, 5 conductors are in the vicinity of the 5.7 K criterion. • There remain doubts if the potential of the strands is fully usedin all conductors. Rainer Wesche, WAMSDO Workshop, CERN, May 19-23, 2008