Download
1 / 25
250 likes | 264 Views
This overview explores the performance indicators used in the CFSR2 data, focusing on seven outcomes related to safety, permanency, and child and family well-being. It also evaluates the systemic factors and national standards used in the assessment. The goal is to improve state performance on all measures and composite scores, leading to better outcomes for children.

E N D
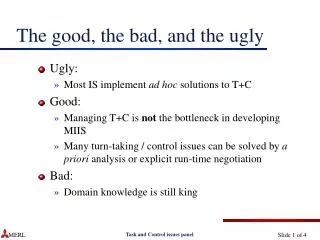
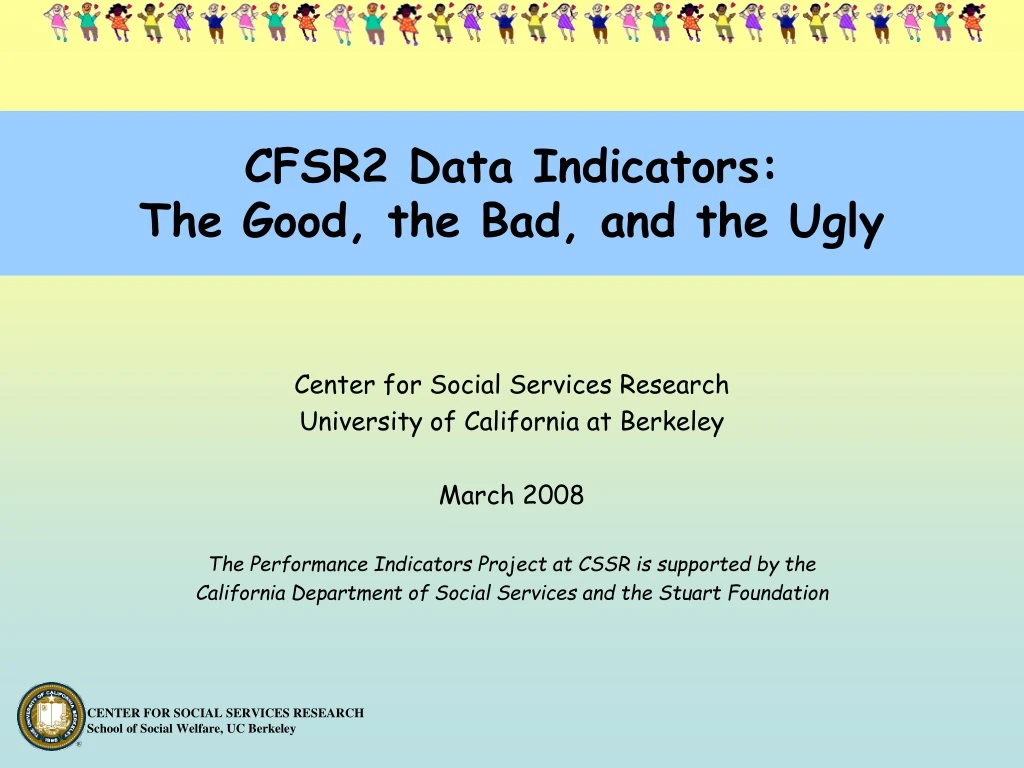
CFSR2 Data Indicators:The Good, the Bad, and the Ugly Center for Social Services Research University of California at Berkeley March 2008 The Performance Indicators Project at CSSR is supported by the California Department of Social Services and the Stuart Foundation
Overview of Key Changes… • Move from individual measures to data composites for evaluating permanency (no such change for evaluating safety) • Adjustment of National Standards based on most recent data available • Measures reversed (where necessary) so that higher score equals better performance (easier to interpret) • Some changes in time periods for given measures
CFSR: Seven Outcomes Safety • Children are, first and foremost, protected from abuse and neglect. • Children are safely maintained in their homes whenever possible and appropriate. Permanency • Children have permanency and stability in their living arrangements. • The continuity of family relationships and connections is preserved for children. Child and Family Well-Being • Families have enhanced capacity to provide for their children's needs. • Children receive appropriate services to meet their educational needs. • Children receive adequate services to meet their physical and mental health needs.
CFSR: Seven Systemic Factors • Statewide information system • Case review system • Quality assurance program • Staff and provider training • Service array • Agency responsiveness to the community • Foster and adoptive parent licensing, recruitment and retention
CA CWS Outcomes System • Round 1 of the CFSRs • 2 of the “outcomes” = 6 items (2 for safety, 4 for permanency) • National Standards attached: based on the 75th %tile of reporting states • States failing to meet a given standard had to include that item in their Performance Improvement Plans (PIPs) • Round 2 of the CFSRs • Also comprised of 6 items with standards attached • BUT…this time the permanency standards are comprised of 15 different measures distilled into four composites • TOTAL of 17 FEDERAL MEASURES
Indicator 1 Safety Indicator 2 Measure 1 Measure 2 Measure 3 Measure 4 Component A Component B Composite 1 Measure 1 Measure 2 Measure 3 Measure 4 Measure 5 Component A Component B Component C Composite 2 Permanency Measure 1 Measure 2 Measure 3 Component A Component B Composite 3 Composite 4 Measure 1 Measure 2 Measure 3
S1.1 Safety S2.1 C1.1 C1.2 C1.3 C1.4 Composite 1: Reunification C2.1 C2.2 C2.3 C2.4 C2.5 Composite 2: Adoption Permanency Composite 3: Long-Term C3.1 C3.2 C3.3 Composite 4: Placement C4.1 C4.2 C4.3
National Standards • National standards for both the safety indicators and permanency composites are based on State performance in 2004, 75th percentile • In California, we at CSSR will attempt to replicate each of the measures and composite scores, break them out by child welfare and probation agencies, and report/update quarterly. • Although national standards have been set for the composites rather than individual measures… • The goal is to improve State performance on all measures (every improvement reflects a better outcome for children) • Improvement on any given measure will result in an increase in the overall composite score • Analogous to Academic Achievement Test Scoring…
Evaluating Safety: S1.1 (Safety Indicator 1) Nat’l Std=94.6% S2.1 (Safety Indicator 2) Nat’l Std=99.68% • Of all children who were victims of a substantiated maltreatment allegation during the first 6 months of a year, what percent were not victims of another substantiated maltreatment allegation within the next 6-month period? • Of all children served in foster care during the year, what percent were not victims of a substantiated maltreatment allegation by a foster parent or facility staff member?
Principal Components Analysis (PCA)(the “black box” version) Three components based on related measures! A bunch of measures… Median Time in Care Emancipating from Care Recurrence of Maltreatment black box of fancy statistical tools Component #1 Timeliness of Reunification Abuse in Foster Care Component #2 Permanency of Reunification Placement Stability Component #3 Timeliness of Adoption
Z-Scores? • Before dumping all of the measures into the PCA “Black Box”, they were transformed into standard scores (z-scores) • A z-score serves two purposes: Puts measures in the same “range” Sets measures to the same “system”
And an Example… • A researcher interested in measuring “success” in high school. • Collects the following measures for each student: • Athletic Ability • Good Grades • Physical Attractiveness • Interest in Sports • Chess Club Membership • Science Club Membership • Social Life Principal Components Analysis…
Explores the contribution of each part to the whole: Structures the data into independent components: Reduces the number of individual measures: Athletic Ability Jock Component = Interest in Sports Interest in Sports Athletic Ability Good Grades Chess Club Member Science Club Member Physical Attractiveness Active Social Life VERY HIGHLY ASSOCIATED!! Brainiac Component = Good Grades Chess Club Member Popular Kids Component = Physical Attractiveness Active Social Life
Composite 1:Timeliness and Permanency of Reunification Timeliness (Component A) Permanency (Component B) C1.1 • Reunification within 12 months (exit cohort) C1.2 • Median time to reunification (exit cohort) C1.3 • Reunification within 12 months (entry cohort) C1.4 • Reentry following reunification
Composite 2:Timeliness of Adoption C2.1 Adoption within 24 months (exit cohort) C2.2 Median time to adoption (exit cohort) C2.3 Adoption Within 12 Months (17 Months In Care) C2.4 Legally Free Within 6 Months (17 Months In Care) C2.5 Adoption Within 12 Months (Legally Free)
Composite 3:Permanency for Children in Long Term Care C3.1 Exits To Permanency (24 Months In Care) C3.2 Exits To Permanency (Legally Free At Exit) In Care 3 Years Or Longer (Emancipated or Age 18 In Care) C3.3
Composite 4:Placement Stability C4.1 Placement Stability (8 Days To 12 Months In Care) C4.2 Placement Stability (12 To 24 Months In Care) C4.3 Placement Stability (At Least 24 Months In Care)
Timeliness & Permanency of Reunification (Scaled) State Composite Score (Transformed to position on national 50-150 scale) (Un-Scaled) State Composite Score (County weighted scores summed and divided by total # of children served) (Weighted) County Composite Score (# of Children in Foster Care x Score) (Un-Weighted) County Composite Score (Component A + Component B / 2) Component A Timeliness of Reunification (Sum of Weighted Measures) Component B Permanency of Reunification (Sum of Weighted Measures) Std Measure1 x Weight (0.462) Std Measure2 x Weight (0.451) Std Measure3 x Weight (0.295) Std Measure4 x Weight (0.129) Std Measure1 x Weight (0.085) Std Measure2 x Weight (0.070) Std Measure3 x Weight (-0.005) Std Measure4 x Weight (1.025)
What else is new? • Move from static to dynamic website • Possible to still review change over time • 75th percentile for measures posted (national goal) • Several 636 Measures have been dropped • ‘Old’ to ‘New’ Document (posted with county spreadsheets)
Emily Putnam-Hornstein eputnamhornstein@berkeley.edu Barbara Needell bneedell@berkeley.edu CSSR.BERKELEY.EDU/UCB_CHILDWELFARE Needell, B., Webster, D., Armijo, M., Lee, S., Cuccaro-Alamin, S., Shaw, T., Dawson, W., Piccus, W., Magruder, J., Exel, M., Conley, A., Smith, J. , Dunn, A., Frerer, K., & Putnam Hornstein, E., (2007). Child Welfare Services Reports for California. Retrieved [month day, year], from University of California at Berkeley Center for Social Services Research website. URL: <http://cssr.berkeley.edu/UCB_CHILDWELFARE/>