Download

1 / 96
960 likes | 1.17k Views
WinSLAMM v 10 2-B Theory and Practice Robert Pitt, John Voorhees, and Caroline Burger PV & Associates LLC Using WinSLAMM ver. 10 Meeting Urban Stormwater Management Goals April 12 – 13, 2012 Madison, WI April 23 – 24, 2012 Baltimore, MD. University of Wisconsin-Madison

E N D
WinSLAMM v 102-B Theory and PracticeRobert Pitt, John Voorhees, and Caroline BurgerPV & Associates LLCUsing WinSLAMM ver. 10 Meeting Urban Stormwater Management GoalsApril 12 – 13, 2012 Madison, WIApril 23 – 24, 2012 Baltimore, MD University of Wisconsin-Madison Engineering Professional Development
WinSLAMM Purpose & History Unique Features of WinSLAMM Model Applications Small Storm Hydrology Basic Program Structure and Operation Treatment Practices Model Input/Output We will cover . . .
Purpose of the Source Loading and Management Model (WinSLAMM). . . • Quantify runoff volumes and pollutant loads from urban areas. • Identify critical sources of runoff and pollutants. • Determine effectiveness of stormwater control practices in reducing runoff volumes and pollutant loads • Selecting most cost-effective combination of practices to achieve environmental goals
WinSLAMM Can Answer These Types of Policy Questions . . . • What are the base level pollutant loadings for different land uses with no controls? • What flow and pollutant levels result from different development scenarios? • What are the critical sources of flows and pollutants? • How effective are treatment practices in controlling pollutants and reducing flows? • What combinations of stormwater controls will best meet regulatory requirements?
Background & History • Development Began in mid-1970’s • Early EPA street cleaning projects • San Jose and Coyote Creek (CA) • Castro Valley and other NURP projects • Mid-1980’s - Model used in Agency Programs: • Ottawa bacteria stormwater management program • Toronto Area Watershed Management Strategy • Wis. Dept. of Natural Resources: Priority Watershed Program • Intensive data collection started in WI in early 1990s. • First Windows version developed in 1995. • Major national and regional research supporting stormwater management issues integrated into model over past decades. • Continuously being updated based on user needs and new research results.
Characteristics of Several of the 114 Research Locations used for Regional Model Calibrations (in addition to WI sites)
Residential Areas Flow Contributions Rains: 1: 0.01”; 2: 0.05”; 3: 0.1”; 4: 0.25”; 5: 0.5”; 6: 0.75”; 7: 1”; 8: 1.5”; 9: 2”; 10: 2.5”; 11: 3”; 12: 4” Commercial Areas Flow Contributions
National Stormwater Quality Database North West Great Lakes East Coast South West Central South East
WinSLAMM Purpose & History Unique Features of WinSLAMM Model Applications Small Storm Hydrology Basic Program Structure and Operation Treatment Practices Model Input/Output We will cover . . .
Unique Features of WinSLAMM (and why it was developed!) • WinSLAMM based on actual monitoring results at many scales and conditions. • Early research project results in the 1970s did not conform to typical stormwater assumptions (especially rainfall-runoff relationships and sources of pollutants; way before we had long lists of control practices too!). • Initial versions of the model therefore focused on site hydrology and particulate sources and transport (and public works practices). Other control practices added as they were developed and data become available.
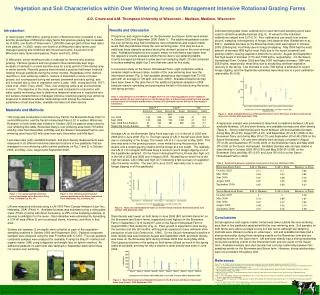
Controlled tests in small areas were used in conjunction with long-term rainfall/runoff monitoring at larger parking lot areas to develop actual hydrological relationships for paved areas, the most significant source of runoff for most urban areas during small to intermediate-sized rains. This is an example of a rainfall-runoff plot from one of many controlled street washoff and runoff tests. About 1/3 of the rainfall is infiltrated through the street pavement for many of these events (up to 20 mm rains in this plot). No further infiltration was observed for larger events, resulting in classical pavement Rv values of 0.8 to 0.95 for large rains of interest for drainage design. Pitt 1987
Infiltration Rates in Disturbed Sandy Urban Soils Sandy Soils Clayey Soils Pitt, et al. 1999 Pitt, et al. 1999 Compaction associated with construction and continuing activities in urban areas results in significantly decreased infiltration rates compared to natural soils. For sandy soils, moisture has little effect on the infiltration rates, while compaction can cause significant runoff (as shown in previous slide of turf area runoff in a very sandy area). For clayey soils, compaction and moisture have similar detrimental effects on the infiltration rates.
Infiltration Measurements for Noncompacted, Sandy Soils (Pitt, et al. 1999) It doesn’t really matter which classical infiltration equation is used, as they all are rather poor fits and do not consider the wide variability in the actual data.
Washoff of Street Dirt, Bellevue, WA Pitt 1985 Washoff of particulates from urban paved surfaces preferentially favors the smallest particles, with little movement of the larger material, and much is left on the surface.
Mass balance measurements in the drainage system and at the outfall used to determine the fate and transport of the urban particulates. Much of the larger particulates not washed off is lost from the paved surfaces by fugitive dust by winds and traffic turbulence. Measured fugitive dust losses from traffic (San Jose, Pitt 1979)
Measured Particle Sizes, Including Bed Load Component, at influent to the Monroe St. Detention Pond, Madison, WI Very few of the large particles that enter the drainage systems are transported to the outfalls in typical urban drainage systems. Most (about 85% in this typical example) of the outfall particulates discharged are less than 100 µm in size.
WinSLAMM Purpose & History Unique Features of WinSLAMM Model Applications Small Storm Hydrology Basic Program Structure and Operation Treatment Practices Model Input/Output We will cover . . .
Model Applications Model Can Be Applied on Multiple Levels – • Large Scale, City-wide Analysis • Site Development Analysis (Apartment Complex, Shopping Center, Hospital Complex, Residential Development) • Analysis of Single Practice
Model Applications Large Scale, City-wide Analysis Analysis Procedure - • Inventory drainage basins and land uses • Evaluate existing pollutant loads and runoff volumes (base condition). • Adjust base condition with existing stormwater control practices. • Evaluate additional practices to cost-effectively achieve pollutant reduction goals.
Model Applications Large Scale, City-wide Analysis Example – Fond du Lac, WI • Original plan in 2006 indicated City did not meet regulatory goal of 40% TSS reduction (Initial conditions ~ 14%) • 2006 plan included alternative evaluation matrix, developed using WinSLAMM • Matrix included “hard factors” such as cost and pollution reduction and “soft factors” such as public acceptability and secondary benefits • City selected and implemented 2006 plan recommendations between 2006 and 2011, which met 40% TSS reduction goal
Model Applications Large Scale, Regional Analysis Model large, complex areas to determine the effect of stormwater control measuresby combining… AECOM Project – Fond du Lac, WI
Model Applications Large Scale, Regional Analysis Watersheds, subwatersheds and…
Model Applications Large Scale, Regional Analysis Commercial – Orange areas Residential – Purple/Pink areas Land Use and Soil Characteristics to Evaluate… Industrial – Blue areas
Model Applications Large Scale, Regional Analysis More Red – More Pollution More Green – Less Pollution Pollution Load without Stormwater Control Measures
Model Applications Large Scale, Regional Analysis Orange – Catch Basins with Sumps Blue – Wet Detention Ponds Green – Grass Swales Implemented Stormwater Control Measures… Pink – Multiple Measures
Model Applications Large Scale, Regional Analysis Many areas went from “red” to “green” Can concentrate on areas that are still “red” Pollution Load with Implemented Stormwater Control Measures
Model Applications Site Development Analysis Analysis Procedure - • Inventory site characteristics (soil type, percent imperviousness, etc.) • Locate selected stormwater controls throughout the site • Determine volume and pollutant reduction achieved with selected stormwater control practices.
Model Applications Porous Pavement Catchbasin with Sump Biofilter Grass Swales Infiltration/Detention Pond Site Development Analysis Enter all the practices for a site to determine the overall runoff and pollutant reduction
Model Applications Wet Detention Pond – Analyze the performance of a specific pond for a specific site Single Practice Analysis Volume and Pollutant Reduction for Biofilters – bioretention, rain gardens, infiltration basins
Capital Cost of Pond Achieving Different TSS Reductions at 100 Acre Mix of 40% Shopping Center and 60% Medium Residential Cost-performance curves are usually not linear, with increasing unit costs as the overall treatment objective increases. For some situations, it may therefore be more cost-effective to apply moderate levels of multiple controls. WinSLAMM can also calculate life-cycle costs that include land costs, capital costs, and operational and maintenance costs, all adjusted for financing costs and inflation factors, and expected life of project.
WinSLAMM Purpose & History Unique Features of WinSLAMM Model Applications Small Storm Hydrology Basic Program Structure and Operation Treatment Practices Model Input/Output We will cover . . .
Knowing the Runoff Volume is the Key to Estimating Pollutant Mass • There is usually a simple relationship between rain depth and runoff depth. • Changes in rain depth affects the relative contributions of runoff and pollutant mass discharges: • Directly connected impervious areas contribute most of the flows during relatively small rains • Disturbed urban soils may dominate during larger rains
Small Storm Hydrology – Runoff Volume Most of the pollutants in stormwater runoff come from small and moderate size storms . . . . . .in contrast to design storms, because the smaller storms are much more frequent and account for the majority of runoff water and pollutants
Monitored Milwaukee Rainfall and Runoff Distributions Small Large Medium
Small Large Medium Monitored Milwaukee Pollutant Distribution Percent Associated with Rain, or less Rain (inches)
Rainfall Sorts into Three Distinct Categories • Small Rains – Accounts for most events, by number • Typically can be easily captured for infiltration or on-site beneficial uses • Relatively low pollutant loadings, but frequent discharges • Key rains associated with water quality violations, e.g. bacteria and total recoverable heavy metals • “Every” time it rains, some numeric discharge concentration objectives are likely to be exceeded, therefore, eliminate the number of events
Rainfall Sorts into Three Distinct Categories • Medium Rains – Responsible for most pollutant mass discharges • Smaller events in this category can be easily captured and infiltrated or re-used • Larger events in this category need to be treated. • Typically responsible for about 75% of pollutant discharges
Rainfall Sorts into Three Distinct Categories • Large Rains – Infrequent Large Events • Not cost effective to treat all runoff • Typically cause flooding and significant erosion • Treatment practices designed for smaller storms will mitigate impacts of larger events to some extent
Soil Type Runoff Volume and Pollutant Load Landuse Area Rainfall Development Characteristics Control Practices These concepts are incorporated into SLAMM SLAMM
WinSLAMM Purpose & History Unique Features of WinSLAMM Model Applications Small Storm Hydrology Basic Program Structure and Operation Treatment Practices Model Input/Output We will cover . . .
Basic Program Structure WinSLAMM Calculation Process Calculate Runoff Volumes and Particulate Loadings for each Source Area Apply Appropriate Drainage System Treatment Practices Route Totals to the Outfall for Volume and Pollutant Discharge to Receiving Waters Apply Appropriate Source Area Treatment Practices Sum Resulting Source Area Outputs Route Totals to the Drainage System
Residential Land Use Source Areas Pitched Roofs Driveways Small Landscaped Areas Residential Land Use Source Areas Pitched Roofs Driveways Sidewalks Small Landscaped Areas Medium Density Residential Land Use Low Density Residential Land Use Storm Sewer Drainage System Grass Swale Drainage System Strip Commercial Land Use Park Land Use Other Urban Land Use Source Areas Playground Sidewalks Large Landscaped Areas Commercial Land Use Source Areas Flat Roofs Parking Driveways Sidewalks Small Landscaped Areas Outfall Freeway Land Use Source Areas Paved Lane and Shoulders Large Turf Areas
Information Needed to support the Basic Program Structure is entered in the Land Development Characteristic (.mdb) file: 1. Land Use type and area2. Size of all Source Areas3. Source Area parameters (soil type, connected imperviousness, street texture, etc.)4. Control Practice designs
This Process is applied through parameter files • Rainfall File (*.ran) • Runoff Coefficient File (v10*.rsv) • Particulate Solids Concentration File (*.pscx) • Pollutant Probability Distribution File (*.ppdx) • Particle Size Parameter File (*.cpz)