Download
1 / 8
80 likes | 233 Views
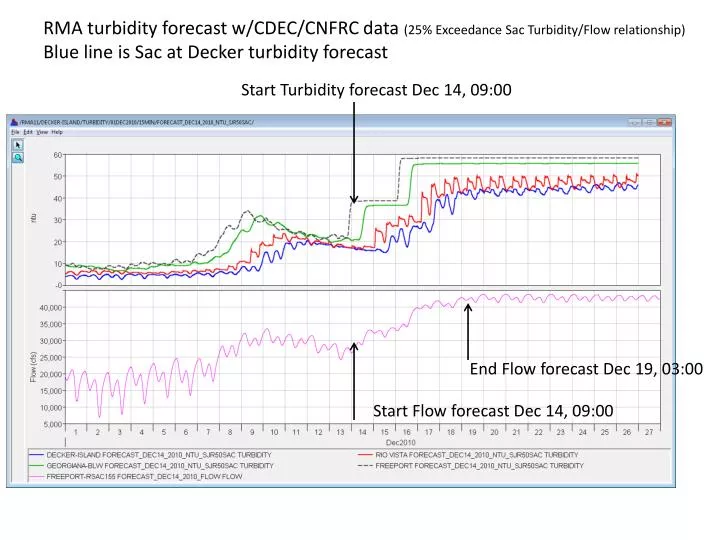
RMA turbidity forecast w/CDEC/CNFRC data (25% Exceedance Sac Turbidity/Flow relationship) Blue line is Sac at Decker turbidity forecast. Start Turbidity forecast Dec 14, 09:00. End Flow forecast Dec 19, 03:00. Start Flow forecast Dec 14, 09:00.

E N D
RMA turbidity forecast w/CDEC/CNFRC data (25% Exceedance Sac Turbidity/Flow relationship) Blue line is Sac at Decker turbidity forecast Start Turbidity forecast Dec 14, 09:00 End Flow forecast Dec 19, 03:00 Start Flow forecast Dec 14, 09:00
RMA turbidity forecast using WARMF flow & turbidity model output Blue line is Sac at Decker turbidity forecast WARMF forecast was run Dec 14th, delivered to RMA late afternoon Begin WARMF forecast
Freeport flow Blue line is CDEC/CNFRC forecast (hourly data) – CNFRC forecasts ends Dec 14th Red line is WARMF forecast (daily data)
Vernalis flow Blue line is CDEC/CNFRC forecast (hourly data) – CNFRC forecasts ends Dec 14th Red line is WARMF forecast (daily data)
Yolo-Lisbon flow Blue line is CDEC/CNFRC forecast (hourly data) – CNFRC forecasts ends Dec 14th Red line is WARMF forecast (daily data)
Calaveras flow Blue line is DWR forecast (daily data) from last week Red line is WARMF forecast (daily data)
Cosumnes Flow Blue line is CDEC/CNFRC forecast (hourly data) – CNFRC forecasts ends Dec 14th Red line is WARMF forecast (daily data)
Mokelumne Flow Blue line is DWR forecast (daily data) from last week Red line is WARMF forecast (daily data)


![2014-09-14 22:38:10.287 Sugar [1683:60b] Mac Address : 02:00:00:00:00:00](https://cdn3.slideserve.com/6137506/slide1-dt.jpg)