Download
1 / 1
20 likes | 170 Views
Evaluation of Groundwater Storage variations in various large aquifers using GRACE data. S. Munier , M. Becker, P. Maisongrande and A. Cazenave LEGOS/GOHS – UMR5566/CNES/CNRS/IRD/UPS – 14 avenue E. Belin 31400 Toulouse, FRANCE. Contact: simon.munier@legos.obs-mip.fr. 1. INTRODUCTION

E N D
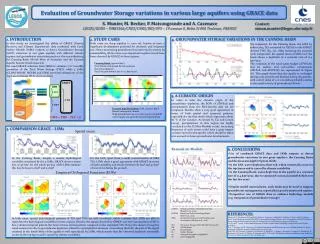
Evaluation of Groundwater Storage variations in various large aquifers using GRACE data S. Munier, M. Becker, P. Maisongrande and A. Cazenave LEGOS/GOHS – UMR5566/CNES/CNRS/IRD/UPS – 14 avenue E. Belin 31400 Toulouse, FRANCE Contact: simon.munier@legos.obs-mip.fr 1. INTRODUCTION In this study, we investigated the ability of GRACE (Gravity Recovery and Climate Experiment) data combined with Land Surface Models (LSMs) outputs to detect Groundwater Storage (GWS) variations in two great aquifers with different climate regimes and groundwater extraction practices: the one underlying the Canning Basin (North West of Australia) and the Guarani Aquifer System (South America). We used GRACE solutions from GRGS to estimate 1°x1° monthly anomalies of the Total Water Storage (TWS), while 3 LSMs (GLDAS-NOAH, WGHM and ISBA) provided estimations of the Top Layers Storage (TLS, 1 to 10 m deep). 2. STUDY CASES Both cases are deep aquifers (> 1000 m), known to have a significant development potential for domestic and irrigation use. Hence monitoring groundwater becomes vital to ensure its sustainability, all the more so as important negative trends have been observed by GRACE in these regions. 4. GROUNDWATER STORAGE VARIATIONS IN THE CANNING BASIN We computed, for the Canning Basin, the GWS by subtracting TLS estimated by GLDAS to the GRACE derived TWS (Eq. (1)). After removing the seasonal cycle component, the spatial mean of GWS over the basin shows a depletion at a constant rate of 11.4 km3/year. The evolution of the total water budget (dTWS/dt) and its surface and sub-surface components (dTLS/dt and dGWS/dt) are represented in Figure (b). This graph shows that the aquifer is recharged during rainy periods and drained during dry periods, with a short delay of 1 or 2 months (probably relative to the small velocity of groundwater flows). Canning Basin (430000 km2) Arid climate dominated by the monsoon Sparsely populated Very low groundwater use (< 0.1 km3/year) GRACE LSM Surface Water TLS Biosphere Soil Moisture 5. A CLIMATIC ORIGIN TWS In order to infer the climatic origin of the groundwater depletion, the EOFs of dTWS/dt and precipitations from the ERA-interim data set are compared. Results show a very good agreement in terms of both spatial and temporal patterns, especially for the first mode which represents about 80 % of the variance. As shown by Cai and Cowan [2009], precipitations in this region are highly correlated to the El Niño Modoki events. Increasing frequency of such events could have a great impact on water stored in the aquifer, which should be taken into account in future groundwater developments. Groundwater GWS Guarani Aquifer System (GAS, 1200000 km2) Humid subtropical climate High groundwater use (1 to 3 km3/year), for public water supply and agricultural and industrial use GWS = TWS – TLS (1) 3. COMPARISON GRACE – LSMs Spatial mean • 6. CONCLUSIONS • Use of combined GRACE data and LSMs outputs to detect groundwater variations in two great aquifers: the Canning Basin and the Guarani Aquifer System (GAS) • In the GAS, water depletion observed, which essentially occurs in the top layers and is caused by climate variability • In the Canning Basin, water depletion in the aquifer at a constant rate of 11.4 km3/year, due to sustained seasonal rainfall deficit over the last few years • Despite model uncertainties, such study may be used to support groundwater management, especially in poorly monitored regions • Perspective: use of GRACE data to enhance hydrology models (e.g. integration of groundwater storage) Remark on Models In the Canning Basin, despite a similar hydrological variability simulated by the 3 LSMs, GRACE shows a water loss of 96 km3 for the whole period, while LSMs estimate this loss between 10 km3 and 22 km3. For the GAS, apart from a small overestimation of ISBA TLS, LSMs show a good agreement with GRACE in terms of both variability and trends (between 80 km3 and 90 km3 of water lost during the period). Empirical Orthogonal Functions (EOFs) GLDAS Global Land Data Assimilation System [Rodell et al., 2004] WGHM WaterGap Global Hydrology Model [Doll et al., 2003] ISBA Interactions between Soil, Biosphere and Atmosphere [Alkama et al., 2010] TLS Top Layers Storage (TLS=SM+GW+SS+Cp+Sn) SM Soil Moisture GW Groundwater SS Surface Storage Cp Canopy interception (negligible) SnSnow (negligible) REFERENCES Alkama, R., B. Decharme, H. Douville, M. Becker, A. Cazenave, J. Sheffield, A. Voldoire, S. Tyteca and P. Le Moigne (2010), Global Evaluation of the ISBA-TRIP Continental Hydrological System. Part I: Comparison to GRACE Terrestrial Water Storage Estimates and In Situ River Discharges, Journal of Hydrometeorology, 11 (3):583–600 . Cai, W. and T. Cowan, La Niña Modoki impacts Australia autumn rainfall variability, Geophysical Research Letters, 36:L12805. Doll, P., F. Kaspar, and B. Lehner (2003), A global hydrological model for deriving water availability indicators: model tuning and validation, Journal of Hydrology, 270 (1-2), 105–134. Rodell, M., P. R. Houser, U. Jambor, J. Gottschalck, K. Mitchell, C. J. Meng, K. Arsenault, B. Cosgrove, J. Radakovich, M. Bosilovich, J. K. Entin, J. P. Walker, D. Lohmann and D. Toll (2004), The global land data assimilation system, Bulletin of the American Meteorological Society, 85 (3):381–394. In both cases, spatial and temporal patterns of TLS and TWS are well correlated, which confirms that LSMs are able to reproduce the hydrological variability in these regions. Besides, the signal observed by GRACE over the Canning Basin (EOF 1) has a similar temporal pattern but more intense spatial pattern compared to the simulated TLS. Hence the observed negative trend seems to be due to groundwater depletion related to a precipitation decrease. Concerning the GAS, the part of the signal centered in the South-West of the aquifer is well reproduced by LSMs, which means that the observed depletion essentially occurs in the top layers and is caused by climate variability.