Download

1 / 21
210 likes | 329 Views
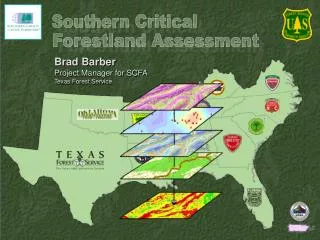
The Southern Critical Forestland Assessment examines critical private forestlands in the Southern U.S., focusing on site productivity, forest resource richness, and threats such as development and wildfire risk. The project integrates multiple data layers, including forest health, riparian areas, and watershed health to map and analyze the significance of these landscapes. Deliverables include a GIS model, maps, and a comprehensive report highlighting state-specific challenges affecting forest management. This assessment emphasizes the importance of safeguarding these vital ecosystems for future sustainability.

E N D
Southern Critical Southern Critical Forestland Assessment Forestland Assessment Brad BarberProject Manager for SCFA Texas Forest Service
Site productivity† Three Output Layers Forest Resource Richness ForestlandForest patches Riparian areas Wetlands Priority watersheds Public water supply Proximity to public land T&E Species Slope Forest Resource Threat Development levelForest health (Insects and diseases) Wildfire risk Critical Private Forestland All 13 of above input layers † Layer added for Southern Region
Other Deliverables GIS Model Compendium of maps Regional and state maps of the three output layers Summary report Analysis methodology, results, maps, and explanation of significance of private forestland in the South Highlight state-specific issues affecting critical private forestland and its management
Forestland National Land Cover Database 19922001 Cover Classes 41, 42, 43, 91 Cover Classes 41, 42, 43, 52, 90 Layer values: 0, 1
Layer Values by Patch Size Layer values: 0, 1 Patch Size (acres) Layer Value Forest Patches Use data from Forestland layer Overlay state maintained roads
Riparian Areas USGS National Hydrography Dataset Buffer streams by 25 meters x stream order Layer values: 0, 1
Wetlands Forested wetlands National Wetlands Inventory (US Fish and Wildlife) Preferred source National Land Cover Database (2001 & 1992) Fill gaps in NWS data Layer values: 0, 1
Priority Watersheds U.S. Environmental Protection Agency (EPA) data on Impaired Waters within 12-digit, Hydrologic Unit Code (HUC) watersheds Based on Clean Water Act Section 303(d) lists that show water quality standards impairment or threats to the attainment of beneficial uses or anti-degradation provisions Layer values: 0, 1
Proximity to Public Land Protected Areas Database (Conservation Biology Institute) Layer values: <0.5 mile = 1; 0.5-1.0 mile = 0.5; >1 mile = 0
Slope 15-30% slope included Layer values: 0, 1
Layer Values for Site Productivity Site Index at 50 years 0.33 0.67 Layer Value Site Productivity Site Productivity SSURGO—NRCS Soil Survey Geographic data Preferred STATSGO—NRCS State Soil Geographic data† Fill in gaps in SSURGO †STATSGO being updated and renamed to Digital General Soil Map of the United States
Development Level U.S. Census Bureau data—1990 and 2000 Layer will include those areas where the number of households increased by 1 to 8 per square kilometer between 1990 and 2000 Layer values: 0, 1
Forest Health Insect and Diseases Data from the forest health risk mapping effort by USDA Forest Service Percent mortality of trees expected over next 15 years < 5 5-1515-25 >25 = 0= 0.33 = 0.67 = 1 Annosus Root Disease Fusiform Rust Beech Bark Disease Southern Pine Beetle Gypsy Moth Balsam Wooly Adelgid
Wildfire Risk Southern Wildfire Risk Assessment = 0 = 0.11 = 0.22 = 0.33 = 0.44 = 0.55 = 0.67 = 0.78 = 0.89 = 1.0
Sensitive Layers Threatened & Endangered Species Layer values: 0, 1 Public Drinking Water Supply Include watersheds (12-digit HUC) in which surface water intake is present and 1-mile buffer surrounding ground water intakes Layer values: 0, 1
Forestland 10.1% Priority watersheds 9.4% Riparian areas 9.4% Development level 9.0% Public drinking water supply 8.9% Forest health 8.8% 8.2% Wildfire risk 7.8% Site productivity 6.8% Wetlands Forest patches 6.6% 6.5% T&E Species 5.5% Proximity to public lands Slope 2.9% Layer Weights Percent Contribution of Each Layer to Overall Composite Output Layer
Percent contribution of layers to model output (values sum to 100) Comparison of Weight Spreads Among States
PR Weighting Weighting done by Ecoregion NLCD 2001 Mapping Zones
Forestland (10.1%) Slope (2.9%) PriorityWatersheds Riparian Areas Forestland 10.1% 9.4% 9.4% PublicWater Supply Development Level Forest Health Wildfire Risk Site Productivity 8.9% 9.0% 8.8% 8.2% 7.8% Proximity toPublic Land Wetlands Forest Patches T&E Species 6.8% 6.6% 6.5% 5.5% Slope 2.9% Layer Weights Percentages sum to 100