Community Structure & Function
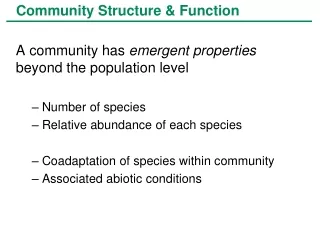
Community Structure & Function. A community has emergent properties beyond the population level Number of species Relative abundance of each species Coadaptation of species within community Associated abiotic conditions. Community Structure and Diversity.

Community Structure & Function
E N D
Presentation Transcript
Community Structure & Function A community has emergent properties beyond the population level • Number of species • Relative abundance of each species • Coadaptation of species within community • Associated abiotic conditions
Community Structure and Diversity • Species richness (S) = the number of species in the community • Species even-ness (or relative abundance) = the proportion that individuals of each species contribute to total individuals of all species
Two measures of community diversity Simpson’s index D = 1/((pi2)) pi = relative abundance of each species = ni / N D = 1 if only 1 species is present (no diversity) Dmax = S if all species have equal numbers (perfect even-ness)
Two measures of community diversity Shannon (or Shannon-Weiner) index H= -(pi)(lnpi) pi = relative abundance of each species = ni / N H = 0 if only 1 species is present (no diversity) Hmax = ln(S) if all species have equal numbers (perfect even-ness)
Species Rank - Abundance Curves incorporate both richness and even-ness
Species Accumulation Curves also reveal richness and even-ness primary forest secondary forest plantation forest Barlow J et al. PNAS 2007;104:18555-18560
Not all species within a community are equivalent KEYSTONE DOMINANT Species Ecological Effect RARE UMBRELLA INDICATOR Species abundance (or biomass)
OP OA OT Otter presence affects kelp density (especially understory kelps)
Otter presence increases kelp density… by reducing urchin density.
OTTER RECOLONIZATION Typically leads to urchin declines - kelp recovery in some cases - but not in others (hysteresis)
Two Contrasting Views of Communities • Clements: ORGANlSMAL concept of community structure: a community is a set of species that are co-adapted to biotic interactions with one another • Gleason: INDIVIDUAL concept of community structure: community is a set of species, but each species responds to environmental gradients independently
Clements Gleason
Ecotones ARE easily recognizable breaks in community structure, but often arise due to adaptations to abiotic factors, rather than biotic interactions among species Some support for each of the two views