Download
1 / 29
290 likes | 547 Views
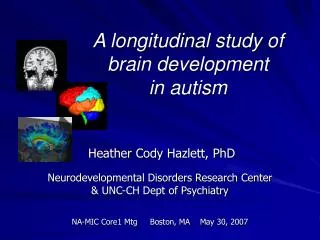
A longitudinal study of brain development in autism. Heather Cody Hazlett, PhD Neurodevelopmental Disorders Research Center & UNC-CH Dept of Psychiatry NA-MIC Core1 Mtg Boston, MA May 30, 2007. Overview. Summary of hypotheses Data available to NA-MIC

E N D
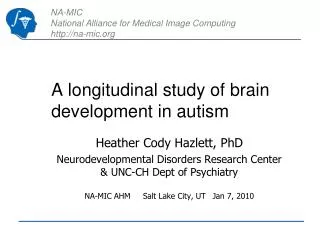
A longitudinal study of brain development in autism Heather Cody Hazlett, PhD Neurodevelopmental Disorders Research Center & UNC-CH Dept of Psychiatry NA-MIC Core1 Mtg Boston, MA May 30, 2007
Overview • Summary of hypotheses • Data available to NA-MIC • Specific requirements/constraints of project • Existing image processing of data • Resources
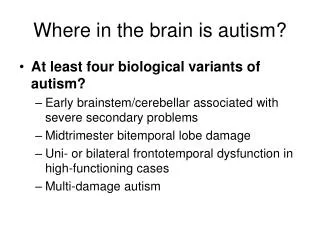
Communication deficits Social deficits Atypical Behaviors Features of Autism
Longitudinal MRI study of brain development in autism • AIMS • To characterize patterns of brain development longitudinally in autism cases versus controls (TYP, DD) • To examine cross-sectional & longitudinal relationships between selected brain regions and behavioral characteristics associated with autism
Longitudinal MRI study of brain development in autism • Hypotheses • Brain enlargement will be present in autism cases compared to controls (TYP, DD) • Brain differences in specific substructures of interest will be seen in autism cases compared to controls, and these differences will correlate with symptoms of autism and/or severity of features
Developmental Studies • Difficult for very young children and/or lower functioning children to remain still • May need to remain motionless for long periods of time • Sleep studies vary in success rates • Subjects may require training and practice – this adds to expense of project
Data Available • Structural MRI • Diffusion Tensor • Behavioral, cognitive, developmental • Processed pediatric longitudinal data
Data* • Structural MRI TI: coronal 3D SPGR IRprep, 0.78 x 0.78 x 1.5 mm, 124 slices, 5 TE/12 TR, 20 FOV, 1 NEX, 256x192 PD/T2: coronal FSE, 0.78 x 0.78 x 3.0 mm, 128 slices, 20 FOV, 17 TE/7200 TR, 1 NEX, 256x160 • DTI axial oblique 2D spin echo EPI, 0.93 x 0.97 x 3.8 mm, 30 slices, 24 FOV, 12 dir *All scans collected on 1.5T GE scanner
Data Processed datasets Time1 (2 yr old) Time2 (4 yr old) EMS/lobes CN AMYG EMS/lobes CN AMYG Autism 49 51 47 29 31 31 (+2 CS) DD 12 9 10 6 5 6 Typical 25 22 21 11 12 10 FX 45 47 47 11 11 10 Also have segmented data for: Put/GP, Hipp, CC area, Ventricles, Ant Cing, Cerebellar vermis
Requirements/Constraints • Registration of images to a common atlas • Inhomogeneities – bias correction • Tissue contrast – myelination • Brain shape changes across development
Tissue segmentation EMS hard segmentations EMS segmentations overlaid on MRI Shown here – 2 year old
Lobe parcellation by template warping Manually-derived parcellation “warped” to new subjects
UNC Longitudinal MRI Study of Autism N % male years (SD) IQ-SS (SD)* Autism51 88% 2.7 (0.3) 54.2 (9.4) Controls25 DD 11 55% 2.7 (0.4) 59.7 (9.4) TYP 14 64% 2.4 (0.4) 107.5 (18.7) * IQ-SS = Mullen composite Standard Score Hazlett et al Arch Gen Psych 2005
UNC Longitudinal MRI Study of Autism autism controls mean (SE) mean (SE) % diff p TBV 1264.6 (13.4) 1208.1 (16.2) 4.7 0.008 cerebrum 941.5 (10.5) 890.5 (12.3) 5.7 0.002 cerebellum 114.1 (1.5) 114.4 (2.2) 0.3 0.9 Adjusted for Gender and Age
UNC Longitudinal MRI Study of Autism autism controls mean (SE) mean (SE) % diff p TBV 1264.6 (13.4) 1208.1 (16.2) 4.7 0.008 cerebrum941.5 (10.5) 890.5 (12.3) 5.7 0.002 gray 676.7 (7.7) 644.2 (8.8) 5.0 0.005 white 264.7 (3.1) 246.2 (3.7) 7.5 0.0001 cerebellum 114.1 (1.5) 114.4 (2.2) 0.3 0.9
Segmented Substructures (ROIs) Basal ganglia • Caudate • Putamen • Globus pallidus Amygdala Hippocampus
Descriptives % Years Cognitive* Adaptive** Group N Male M (SD) M (SD) M (SD) autism 52 87% 2.7 (0.3) 54.1 (9.3) 60.8 (5.9) controls 33 70% 2.6 (0.5) 87.4 (28.6) 850.4 (21.1) developmental delay 12 67% 2.8 (0.4) 55.5 (6.7) 65.8 (14.0) typically developing 21 71% 2.4 (0.5) 106.6 (16.8) 98.3 (13.4) * Cognitive estimate from Mullen Composite Standard Score ** Adaptive behavior estimate from Vineland Adaptive Behavior Composite
Basal Ganglia Volumes in 2 Year Olds with Autism(adjusted for TBV) Aut v Total ControlsAut v TYPAut v DD diff (SE) p % diff (SE) p % diff (SE) p % Caudate .50 (.29) .094 7% 0.8 (.31) .013 12% .20 (.43) .65 3% Globus Pallidus .16 (.29) .09 6% .17 (.10) .094 6% .16 (.12) .20 6% Putamen -.16 (.20) .410 - 2% -.19 (.22) .380 -2% -.14 (.25) .594 -2% Note - all comparisons also adjusted for age and gender
Amygdala/Hippocampus Volume in 2 Year Olds with Autism (adjusted for TBV) Aut v Total Controls Aut v TYP Aut v DD diff (SE) p % diff (SE) p % diff (SE) p % amygdala .35 (.12) .004 10% .55 (.11) <.001 16% .16 (.17) .336 3% hippocampus .03 (.11) .78 1% -.03 (.14) .841 0% .09 (.15) .55 2% *Note – all comparisons also adjusted for age and gender
Other ROIs • Corpus callosum (midsaggital) • Ventricles • Anterior Cingulate • Cerebellar vermis
Resources • CS programmer – Clement Vachet • Image processing RA support (unfunded) • Image processing lab at UNC and existing NA-MIC Cores
NA-MIC Collaboration • Possible Goals/Projects : • Pipelines for growth-rate analysis • Longitudinal analysis of cortical thickness, cortical folding patterns, etc. • Quantify shape changes over time to allow for analysis with behavioral data • Development of new segmentation protocols (e.g., dorsolateral prefrontal cortex)
NA-MIC Collaboration • Our site can offer NAMIC collaborators: • Existing pediatric dataset of sMRI & DTI • Longitudinal data (imaging & behavioral) • Segmented datasets to be used as validation tools (e.g., comparison to FreeSurfer) • Already collaborating with NA-MIC (e.g., multiple shape analysis papers at MICCAI, shape analysis component already in Slicer)
Contributors Martin Styner, PhD Allison Ross, MD James MacFall, PhD Alan Song, PhD Valerie Jewells, MD James Provenzale, MD Greg McCarthy, Ph.D. John Gilmore, MD Allen Reiss, MD UNC Fragile X Center NDRC Research Registry Funded by the National Institutes of Health Joe Piven, MD Guido Gerig, PhD Sarang Joshi, PhD Michele Poe, PhD Chad Chappell, MA Judy Morrow, PhD Nancy Garrett, BS, OTA Robin Morris, BA Rachel Smith, BA Mike Graves, MChE Sarah Peterson, BA Matthieu Jomier, MS Carissa Cascio, PhD Matt Mosconi, PhD