Download
1 / 14
140 likes | 232 Views
Motions of isolated G-band bright points in the solar photosphere. P. Nisenson, A.A. van Ballegooijen, A.G. De Wijn, and P. Sutterlin 2003, ApJ, 587, 458-463. Abstract. Motions of isolated bright points are measured using a long sequence of G-band images recorded with Dutch Open Telescope.

E N D
Motions of isolated G-band bright points in the solar photosphere P. Nisenson, A.A. van Ballegooijen, A.G. De Wijn, and P. Sutterlin 2003, ApJ, 587, 458-463
Abstract • Motions of isolated bright points are measured using a long sequence of G-band images recorded with Dutch Open Telescope. • The accuracy of position measurement < 23 km • The rms velocit about 0.89 km/s, the correlation time about 60 sec. • Evidence of vorticity is searched.
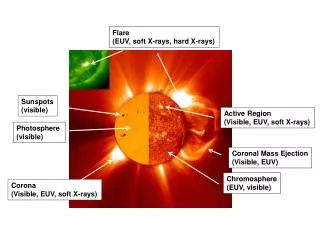
Introduction • G-band bright points (BPs) • size ≈100 km • velocity ≈1km/s • located in the intergranular lanes • seen also in the wings of Halpha, CaIIH,K, photospheric lines and even in continuum. • Rapid splitting and merging (Berger et al. 1998) • Motions are reasonably agree with passive advection by the granulation flow (van Ballegooijen et al. 1998).
BPs correspond to small and strong magnetic flux tube. Investigating the dynamics of BPs serves to understand: • interaction of magnetic field and turbulent convection (granulation) • MHD wave generation and its consequence to coronal heating problem • Theoretical models (e.g., Stein and Nordlund 2000) predict that vorticity is concentrated in the lanes and magnetic field elements exhibit ritational motions. => Serch for evidence of the vorticty in the motion of BPs.
Observations • Dutch Open Telescope (43.8 cm, 0”.071/pixel) • 100 frames collected in 30s are combined into single reconstructed frame using speckle image processing. => 199 frames with 0”.2 resolution. • The images are co-aligned using correlation tracking. Therefore the measured velocity of BPs are relative to the granulation. • Positions ofisolated BPs are determined by visual inspeciton (using a cursor) => 2992 positions for 161 BPs.
Results: velocity distribution • rms velocity 1.31 km/s • larger than velocities measured by cork tracking (van Bellagooijen 199). Probably due to the effect of selecting only isolated BPs.
Results: direction angle • Δφhas a broad peak at 0. No clear evidence for vorticity.
Motivation • I have been analysing Yohkoh/SXT data to measure the rate of magnetic reconnection (Vinflow/VA) in solar flares (Isobe et al. 2002, 2003?). • For this purpose, it is essential to measure the energy release rate as accurately as possible. • I carried out a series of 1D hydrodymamic simulation of a flare and chromospheric evaporation. By convolving the simulation result with SXT response function, I calculated the observed energy release rate.
Model • 1D hydrodymamics with heat conduction. • Initial condition is hydrostatic photospere-chromosphere-corona. Flare energy is deposited at the loop sumit by hand. • The simulation result is convolved with the response function and Thich Al. and Be filter of SXT. Then temperature and emission measure is derived by ordinary fileter ratio method. =>Observed energy release rate