Download
1 / 11
120 likes | 217 Views
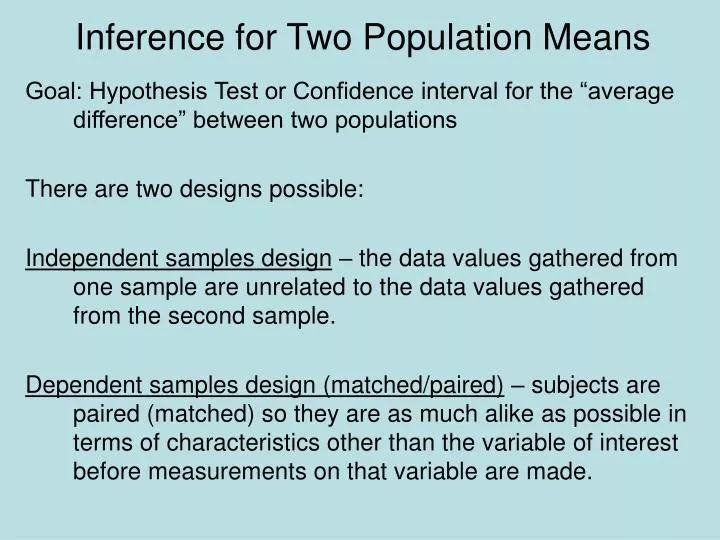
Inference for Two Population Means. Goal: Hypothesis Test or Confidence interval for the “average difference” between two populations There are two designs possible:

E N D
Inference for Two Population Means Goal: Hypothesis Test or Confidence interval for the “average difference” between two populations There are two designs possible: Independent samples design – the data values gathered from one sample are unrelated to the data values gathered from the second sample. Dependent samples design (matched/paired) – subjects are paired (matched) so they are as much alike as possible in terms of characteristics other than the variable of interest before measurements on that variable are made.
Examples of Independent Samples Independent samples design: (samples sizes can be different) Independently select a different sample from each of the two populations Example: Randomly select 35 males and 35 females. Measure their diastolic blood pressures to see if there is a significant difference based on gender. The two populations of interest are (1) blood pressures for males and (2) blood pressures for females. Notice the two samples were selected from the populations without trying to match people based on family or personal history in terms of health.
Examples of Independent Samples Independent samples design: (samples sizes can be different) Independently select a different sample from each of the two populations Example: Randomly select 40 NKU athletes and 35 non-athletes (not on NKU teams). Measure GPA’s to see if there is a difference. The two populations of interest are (1) GPAs for athletes and (2) GPAs for non-athletes. Notice the two samples were selected from the populations without trying to match people based on prior academic performance, number of hours enrolled, etc.
Examples of Independent Samples Independent samples design: (samples sizes can be different) Another way to use the independent samples design is to take a large sample (say 100 subjects) and randomly assign them to two “treatment” groups. Again, sample sizes may be different Example: For testing 2 drugs, randomly assign 50 people to drug A and 50 people to drug B. No matching based on health, income level, etc. is assumed in this case. Then measure reactions based on the drug taken (time until relief, reduction in blood pressure, etc.).
Examples of Independent Samples Independent samples design: (samples sizes can be different) Example: Take a sample of 500 incoming students, and randomly assign them to one of two “learning communities” (a group of classes all students take together). Measure outcomes (GPAs for these classes) to determine if one set of classes seems to work better as a collection than another. Again, there is no matching stated in this case, so this would be independent samples.
Examples of Dependent Samples Dependent samples design (matched/paired): subjects are measured twice – apply both “treatments” to the same subject. Example: Examine pretest and posttest scores for the same person. Do this for a total of 50 students. This can be used to examine how much a student learned in the class. Now a student who already knew the material would not show much improvement or increase in knowledge, while a student with little knowledge of the subject should show vast increases. This eliminates comparisons between students who have prior knowledge and those who do not for a given subject.
Examples of Dependent Samples Dependent samples design (matched/paired): subjects are measured twice – apply both treatments to the same subject. Example: Measure reactions to two medicines for the same person. Again examine this pair of measurements for several patients. This will allow a better measurement of effectiveness since you no longer need to worry about “health” and “lifestyle” since the same person is measured twice. High blood pressure, high cholesterol, active vs. sedimentary lifestyle patients, etc are all accounted for in this scenario.
Examples of Dependent Samples Dependent samples design (matched/paired): (another way) subjects are paired in some way before the experiment is conducted – measure differences between subjects Example: Pair patients based on blood pressure, then measure different reactions (blood pressure reduction) for two types of medicine, one given to each patient in each pair. This eliminates differences between pairs of patients, which hopefully gives a much better measure of how different the two medications are, regardless of other health characteristics.
Examples of Dependent Samples Dependent samples design (matched/paired): subjects are paired in some way before the experiment is conducted – measure differences between subjects Example: Match children based on socio-economic status; then assign to two types of teaching methods and measure learning (test scores). So children with more support at home and more educational opportunities are matched. Also children from homes where both parents have to work fulltime (or maybe multiple jobs) are matched. The only difference should be the two teaching methods.
Examples of Dependent Samples Dependent samples design (matched/paired): subjects are paired in some way before the experiment is conducted – measure differences between subjects Example: Dr. Agard and Dr. Miller both claim to be the better Statistics professor. (not really, but let’s pretend) To determine who is better, match students based on ACT Math scores (one student with ACT Math = 20 from Dr. Agard’s class and one student with ACT Math = 20 from Dr. Miller’s class; repeat for various scores), then measure their performances in STA 205. This eliminates differences based on math ability, as measured by ACT, from making one teacher look better, if it is the prior ability instead of instruction.
Independent Versus Dependent Designs You will need to be able to distinguish between these two methods. Once you determine whether the design is independent samples or dependent samples, the remaining analysis is straight-forward. Actually, for dependent samples designs, we take differences of the pairs and then use exactly the same methods as we covered in t-tests before.