Download
1 / 36
450 likes | 830 Views
Cardiovascular risk in Chronic Renal Disease. Giancarlo Viberti, MD Professor of Diabetes and Metabolic Medicine GKT School of Medicine Guy’s Hospital King’s College London London, UK. Excess Mortality With Hypertension and Proteinuria in Type 2 Diabetes.

E N D
Cardiovascular risk in Chronic Renal Disease • Giancarlo Viberti, MDProfessor of Diabetes and Metabolic MedicineGKT School of MedicineGuy’s HospitalKing’s College LondonLondon, UK
Excess Mortality With Hypertensionand Proteinuria in Type 2 Diabetes Status of Hypertension (H) and Proteinuria (P) in Type 2 Diabetes 1000 StandardizedMortality Ratio 500 0 P-H- P-H+ P+H- P+H+ P-H- P-H+ P+H- P+H+ Men Women Wang SL et al. Diabetes Care. 1996;19:305-312.
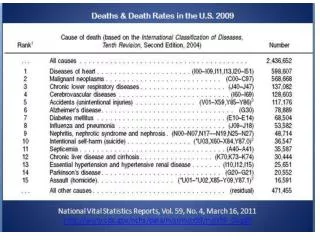
Increasing Death Rate Due to Diabetes 140 130 120 110 100 90 80 70 60 Diabetes Age-AdjustedDeath Rate Relative to 1980 Cancer Cardiovascular Disease Stroke 1980 1982 1984 1986 1988 1990 1992 1994 1996 Year
Risk of myocardial infarction is increased in type 2 diabetes * 50% 45.0% No prior myocardial infarction 40% Prior myocardial infarction Risk of fatal or nonfatal myocardial infarction 30% * 20.2% 18.8% 20% 10% 3.5% 0% Nondiabetic subjects (n = 1,373) Type 2 diabetic subjects (n = 1,059) Seven-year incidence in a Finnish-based cohort. *P < 0.001 Adapted from Haffner SM. New Engl J Med 1998; 339:229–234.
Proteinuria is an Independent Risk Factor for Mortality in Type 2 Diabetes 1.0 Normoalbuminuria (n = 191) 0.9 P <.01 Microalbuminuria (n = 86) 0.8 Survival (all-cause mortality) P <.05 0.7 Macroalbuminuria* (n = 51) 0.6 0.5 0 1 2 3 4 5 6 Years *P < 0.001 normoalbuminuria vs macroalbuminuria. Gall MA et al. Diabetes. 1995;44:1303-1309.
Relative risk of CVD and mortality in3498 DM by quartile of albuminuria (ACR) ACR (mg/mmol) quartiles RR (95% CI) Gerstein et al. JAMA 2001
Relative risk of CVD and mortality in5545 patients without diabetes by quartile of albuminuria (ACR) ACR (mg/mmol) quartiles RR (95% CI) Gerstein et al. JAMA 2001
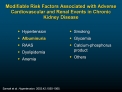
The Metabolic Syndrome: a network of atherogenic factors Genetic factors Environmental factors Hyperglycemia/IGT Dyslipidemia Hypertension Endothelial dysfunction/ Microalbuminuria Hypofibrinolysis Inflammation Insulin Resistance Atherosclerosis Adapted from McFarlane S, et al. J Clin Endocrinol Metab. 2001; 86:713–718.
PWV and mortality in patients with ESRD on RRT Blacher J et al. Kidney Int; 63 :1852, 2003
Patients (n) Diabetes Hypertension Projection 50% 27% 95% CI Diabetes: The Most Common Cause of ESRD Primary Diagnosis for Patients Who Start Dialysis Other Glomerulonephritis 10% 13% 700 600 500 No. of Dialysis Patients (thousands) 400 520,240 300 281,355 200 243,524 100 r2 = 99.8% 0 1984 1988 1992 1996 2004 2000 2008 United States Renal Data System. USRDS 2000Annual Data Report. June 2000.
2.0%(1.9% to 2.2%) 2.8%(2.5% to 3.2%) 2.3%(1.5% to 3.0%) Annual Transition Rates Through Stages of DN No nephropathy 1.4%(1.3% to 1.5%) Microalbuminuria 3.0%(2.6% to 3.4%) DEATH Macroalbuminuria 4.6%(3.6% to 5.7%) Elevated plasma creatinine or Renal replacement therapy 19.2%(14.0% to 24.4%) DN = diabetic nephropathy. Adler et al. Kidney Int. 2003;63:225-232.
Mortality Among Patients With Type 2 DM With and Without Microalbuminuria (7-year follow-up) All-Cause CHD Stroke Other n (%) n (%) n (%) n (%) NIDDM with microalbuminuria (n = 37) NIDDM with normoalbuminuria (n = 109) 18 (49) 13 (72) 2 (11) 3 (17) 18 (17) 13 (32) 0 (0) 11 (61) NIDDM = non–insulin-dependent diabetes mellitus.Mattock MB et al. Diabetes. 1998; 47:1786-1792.
Heritability of AER in families of type 2 diabetic patients Percent Resemblance Fathers Mothers (n=156) (n=178) All offspring (n=478) AER 2915 3112 AER adjusted for SBP 2715 3413 Sons (n=225) AER 1517 3515 AER adjusted for SBP 1218 3916 Daughters (n=253) AER 3419 2916 AER adjusted for SBP 3120 3516 Data are age and FBG adjusted Forsblom 1999
Association of microalbuminuria with non traditional cardiovascular risk factors in 1481 subjects in the IRAS Festa et al. Kidney Int. 2000
Risk Factors for Mortality in Patients With Type 2 DM – 9 Year Follow-up RR (95% CI) adjusted for conventional risk factors N = 328 patients; *P < 0.01; †P < 0.05. vWf = von Willebrand factor; CRP = C-reactive protein. Stehouwer et al. Diabetes. 2002;51:1157-1165.
The Renin System and Therapeutic Intervention Angiotensinogen Renin Angiotensin I Bradykinin ACE inhibitor Angiotensin- converting enzyme X X Angiotensin II X Angiotensin receptor blocker Degradation products AT1 receptor AT2 receptor Glomerulosclerosis Vasoconstriction Antiproliferation Vasodilation Na/fluid retention SMC proliferation
Effects of ACE-Is in Type 1 Diabetes With Microalbuminuria* • ACE-Is reduced progression to macroalbuminuria by 62% • ACE-Is increased regression to normoalbuminuria threefold • AER-lowering effect depended on baseline AER • 18% at 20 µg/min, 48% at 50 µg/min • 63% at 100 µg/min, 74% at 200 µg/min • ACE-I effects independent of age, gender, BP, HbA1c, and duration of DM *Meta-analysis of 10 trials: 326 patients on ACE-Is, 320 on placebo. ACE Inhibitors in Diabetic Nephropathy Trialist Group. Ann Intern Med. 2001;134:370-379.
IRMA-2: Blood Pressure Reduction 153 153 153 145 143 142 mm Hg 90 90 91 84 84 84 Baseline On Treatment (150 mg) On Treatment (300 mg) (n = 201) 150 mg (n = 195) 300 mg (n = 194) IRMA-2 = Irbesartan in Patients with Type 2 Diabetes and Microalbuminura. Parving H-H et al. N Engl J Med. 2001;345:870-878.
IRMA 2: Incidence of Diabetic Nephropathy 20 RR = 70% Placebo 15 Irbesartan*150 mg/d Incidence of DiabeticNephropathy (%) 10 5 Irbesartan* 300 mg/d 0 0 6 12 18 22 24 Follow-up (mo) *P < 0.01 vs placebo. Parving H-H et al. N Engl J Med. 2001;345:870-878.
-10 -20 -30 -40 -50 IRMA 2: Renoprotective Effects of Angiotensin II Blockade Independent of BP Lowering 20 10 Placebo 0 * % Change in UAER 150 mg irbesartan 300 mg irbesartan * 0 3 6 12 18 24 Follow-up (mo) *P < 0.001 vs placebo. Adapted from Parving HH et al. N Eng J Med. 2001;345: 870-878.
Valsartan Amlodipine MARVAL: Mean BP Effects in Type 2 Diabetic Patients with MicroAlbuminuria SBP DBP Mean Change from Baseline (mm Hg) at 24 weeks -6.6 -6.5 -11.2 -11.6 MARVAL = MicroAlbuminuria Reduction with Valsartan trial Viberti G. Circulation. 2002;106:672-678.
Valsartan Reduces UAER to a Greater Extent than Amlodipine in Type 2 DM Primary End Point Valsartan 24 Wks Baseline Amlodipine 24 Wks 70 P < 0.001 60 UAER (µg/min) 50 40 30 20 10 0 Valsartan Amlodipine Adapted from Viberti G et al. Circulation. 2002;106:672-678.
35 29.9%* 30 25 20 14.5% 15 10 5 0 Amlodipine Valsartan Corrects Microalbuminuria to a Greater Extent than Amlodipine in Type 2 DM % of Patients Returning to Normoalbuminuria Valsartan Normoalbuminuria = UAER < 20 g/min; *P = 0.001 vs. amlodipine Viberti G. Circulation. 2002;106:672-678.
CALM Study: ARB and ACE Inhibitor Increase BP Lowering Mean Reduction in BP (mm Hg) Mogensen CE et al. BMJ. 2000;321:1440-1444.
CALM: Combined Therapy of ARBs and ACE-Is: Effect on Proteinuria 197 Type 2 DM With Microalbuminuria Lisinopril 20 mg Candesartan 16 mg Lisinopril 20 mg Candesartan 16 mg 39% 24% 50% Reduction in Urinary Albumin: Creatinine Ratio (%) CALM = Candesartan and Lisinopril Microalbuminuria Study. Mogensen CE et al.BMJ. 2000;321:1440-1444.
Residual AER PREMIER Study: Effect of Perindopril / Indapamide vs Enalapril on Urinary AER in Type 2 DM With Early DN Perindopril/Indapamide (n = 233) Enalapril (n = 224) - 27% - 42% P= 0.002 Urinary AER(final/baseline)(%) [- 37%,- 16%] [- 50%,- 33%] 95% CI PREMIER = Preterax in Albuminuria Regression. Mogensen CE, Viberti GC et al. Hypertension. 2003;41:1063-1071.
0.2 0.4 0.6 0.8 1.0 1.2 MICRO-HOPE Study: Ramipril Reduces Risk of CVD in Diabetic Patients With Microalbuminuria MICRO-HOPE = Microalbuminurea, Cardiovascular, and Renal Outcomes HOPE Substudy. HOPE Study Investigators. Lancet. 2000;356:860.
30 Placebo 20 RR 28% P = 0.002 % With Event 10 Losartan 0 0 12 24 36 48 Months P (+CT) 762 715 610 347 42 50 Placebo 40 RR 20% P = 0.010 30 % With Event 20 Losartan 10 0 0 12 24 36 48 Months P (+CT) 762 715 610 347 42 42 42 42 42 42 L (+CT) 751 714 625 375 69 69 69 69 69 69 ESRD Doubling of Serum Creatinine RENAAL: Composite Primary End Point Placebo RR 25% 30 P = 0.006 20 Losartan % With Event 10 0 0 12 24 36 48 Months P (+CT) 762 689 554 295 36 36 36 36 36 36 L (+CT) L (+CT) 751 692 583 329 52 52 52 52 52 52 751 714 625 375 69 ESRD or Death RENAAL = Reduction of End Points in NIDDM with the Angiotensin II Antagonist Losartan; Brenner BM et al. N Engl J Med. 2001;345:861-869.
RENAAL: Change From Baseline in Proteinuria* 40 Placebo 20 0 MedianPercent Change P = 0.0001 35% overall reduction -20 -40 Losartan -60 0 12 24 36 48 Months P (+CT) 762 632 529 390 130 130 130 130 130 130 L (+CT) 751 661 558 438 167 167 167 167 167 167 *Proteinuria measured as the urine albumin:creatinine ratio from a first morning void. Brenner BM et al. N Engl J Med. 2001; 345:861-869.
20 15 10 5 0 RENAALFirst Hospitalization for Heart Failure Risk Reduction: 32% p=0.005 P % with event L 0 12 24 36 48 Months P (+CT) 762 685 616 375 53 L (+CT) 751 701 637 388 74 Brenner et al. NEJM 2001
Antihypertensive and Antiproteinuric Responses to Increasing ACE-I Dose Lisinopril Dose (mg) 5 mg 10 mg 15 mg 20 mg 0 -10 -20 -30 % Reduction vs. Control -40 -50 -60 -70 BP Urine protein -80 Adapted from Palla R et al. Int J Clin Pharmacol Res. 1994;14:35-43.
Effect of 40 wk ACEi on ACR in 45 Type 2 DM with early DN with or without aldosterone escape Sato et al Hypertension 2003
Effect of spironolactone Rx (25mg/day) on AER in ACEi- treated Type 2 DM with aldosterone escape Individual AER Mean AER Sato et al Hypertension 2003
Steno 2 Study: Intensive Therapy Reduces the Relative Risk of Microvascular Disease in Patients With Type 2 DM and Microalbuminuria – Follow-up 7.8 Years Relative Risk (95% CI) Variable P Value Nephropathy 0.39 (0.17-0.87) 0.003 Retinopathy 0.42 (0.21-0.86) 0.02 Autonomic 0.37 (0.18-0.79) 0.002 neuropathy Peripheral 1.09 (0.54-2.22) 0.66 neuropathy 0.0 0.5 1.0 1.5 2.0 2.5 Intensive Therapy Better Conventional Therapy Better Gaede P et al. N Engl J Med. 2003;348:383-393.
Steno 2: Intensive Therapy Reduces the Risk of CVD Morbidity and Mortality 60 Conventional therapy 50 Hazard ratio = 0.47 (95% CI 0.24 to 0.73; P = 0.008) 40 Primary CompositeEnd Point (%) 30 20 Intensive therapy 10 0 24 36 48 0 12 60 72 84 96 Months of Follow-up Composite end point = Death from CV causes, nonfatal MI, coronary artery bypass graft, percutaneous coronary intervention, nonfatal stroke, amputation, or surgery for peripheral atherosclerotic artery disease. Gaede P et al. N Engl J Med. 2003;348:383-393.
Conclusions • Proteinuria and chronic renal disease increase the risk of CVD mortality by 3-4 fold • Reduction and normalization of arterial hypertension and proteinuria are key treatment goals for cardiorenal protection • Blockade of the RAAS is critical for preventing progression of renal disease • Multifactorial treatment regimens should include, whenever possible, agents that block the RAAS