Download
1 / 57
580 likes | 771 Views
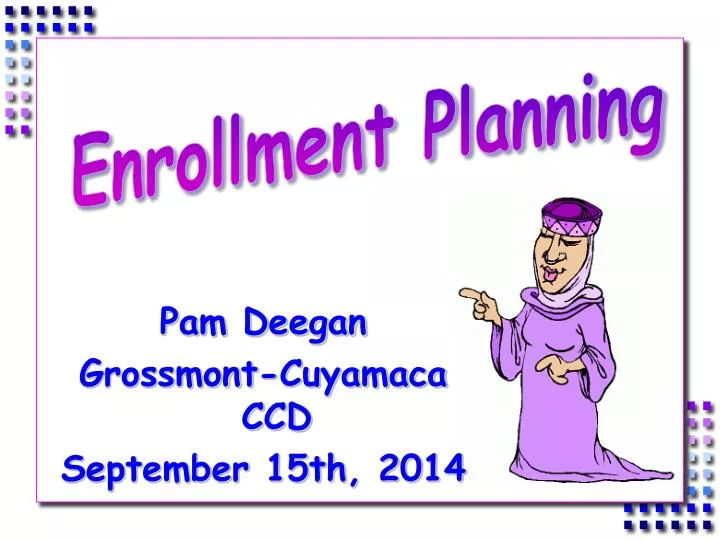
Enrollment Planning. Pam Deegan Grossmont - Cuyamaca CCD September 15th, 2014. Limited mission. Repeatability. Budget scrutiny. Student Success Act. Accreditation. Transfer Degrees. What is Enrollment Planning?. Integral part of colleges’ and district’s planning processes

E N D
Enrollment Planning Pam Deegan Grossmont-Cuyamaca CCD September 15th, 2014
Limited mission Repeatability Budget scrutiny Student Success Act Accreditation Transfer Degrees
What is Enrollment Planning? • Integral part of colleges’ and district’s planning processes • A plan that aligns services and resources in a systematic, planned manner • A plan that is based upon data • A plan that is examined and updated constantly
Who is Involved? • Should be a shared vision • At operational level, key administrators and their management teams should be involved • CEO • CIO ** • CSSO • CBO • PIO • Institutional researcher
What Information do You Need?? • Ability to access reliable historical information • Ability to project enrollments based on historical information • Ability to actively monitor live data to make decisions • Ability to access the “rules”, ones which are clearly communicated to the entire college - transparency
FTES 1 Full-time Equivalent Student (FTES) is equal to 1 student enrolled in 15 semester hours for 2 semesters. This has nothing to do with units !
What is the difference between headcount and FTES?
What is FTES? What is Headcount? In the following example, Meagan, Debbie, and Carlos are each students at College of Knowledge Community College. In headcount, we count each student as an individual regardless of the number of classes or hours they are taking. With our example below, we have 3 people, therefore our headcount is 3. This is different than FTES (Full-time Equivalent Student). One FTES is equal to enrollment in 15 semester hours (not units) each week for 2 semesters. For those students who attend less than 15 hours each week, we piece their hours together. In our example, Meagan’s 9 hours, Debbie’s 3 hours, and Carlos’ 3 hours equal 15 hours and are therefore equal to 1 FTES, if they took the same hours Fall and Spring. Three people, but only 1 FTES. Carlos Debbie Meagan 9 hours Microbiology Lecture & lab 3 hours Creative Writing 3 hours Math 15 hours = + +
Daily Contact Hour (DCH) • The time a class meets each day • Based on 50-minute hour (each real hour consists of 50 minutes of instruction and 10 minutes of passing or break time.)
Class Hour • Can’t be less than 50 minutes • A class hour is commonly called a contact hour or student contact hour.
How do you calculate DCH when the Scheduled Time goes Beyond an Hour? Using 8:00-9:05 as an example: 8:00-8:50 = 1.0 + 8:50-9:00 = 0.2 (converted break time) + 9:00-9:05 = 0.1 1.3 Contact Hours
OR 50 is the divisor in calculating contact hours for fractional extension of the hour: 65 Minutes/50 = 1.3 Contact Hours
Daily Student Contact Hour(DSCH) • Daily Contact Hour (DCH) X Number of Students
WCH WCH = Weekly Contact Hours • This tells us how many hours the class meets each week. • WCH is the DCH times the number of days the class meets each week. • When we look at our total WCH, we are looking at the size of our schedule. Each department can be assigned a certain number of WCH to schedule for each term—fall, spring, and summer.
WSCH WSCH • WSCH = Weekly Student Contact Hours This tells us how many student hours we have and is the intermediate step in calculating FTES. • How to calculate a rough estimate of FTES • WSCH is calculated by the following: WCH X Enrollment = WSCH • What else is WSCH used for?
Enrollment • Enrollment = the number of students in the class • Until we know what the actual enrollments are, it is handy to use estimates. You need some sort of system to do this. • We utilize estimates so that we can project what our total enrollments will be as soon as we plan the schedule. The time of day, number of sections, the individual teaching the class all come into play.
Census • These enrollments always fluctuate. For purposes of funding, the state takes a “snapshot” in time at the first 20% of the course. This is called Census. For a full 18-week semester, this occurs Monday of the 4th week. It is the 3rd week for 16 weeks. • Daily Census is class by class.
FTEF Full-time Equivalent Faculty • Used for different purposes • FTEF is the portion of a full-time load which each particular class represents. • Example – If a full-time faculty member has a load that consists of 15 hours (LED), a 3 hour class represents what percentage of this faculty member’s load?
More Definitions
Are We Efficient?or The Cost of Generating FTES • Statewide, a measure of efficiency is WSCH/FTEF where WSCH is divided by the Full-time Equivalent Faculty (FTEF). This tells us how much of a faculty load it takes to generate a given WSCH.
Statewide, a WSCH/FTEF of 525 represents the point of financial break even for a college (for 18 week semester). • What is the break even for a class? • Will everyone have the same WSCH/FTEF?
Number of Students in a Class 32 students X 3 WCH = 96 WSCH/.20 = 480 WSCH/FTEF 33 students X 3 WCH = 99 WSCH/.20 = 495 WSCH/FTEF 34 students X 3 WCH = 102 WSCH/.20 = 510 WSCH/FTEF 35 students X 3 WCH = 105 WSCH/.20 = 525 WSCH/FTEF
Same WSCH/FTEF ???? 30 students X 3 WCH = 90 WSCH/.20 = 450 WSCH/FTES It is about balance !
It comes from . . . • 1 FTES = 15 WCH • 17.5 Weeks/Semester = 35 weeks (maximum TLM) or • 15 WCH x 35 Weeks = 525
How the State of California Calculates FTES • 1. Weekly Census - Regular term length • 2. Daily Census – Short-term classes • 3. Positive Attendance -Classes that do not meet on a regular basis • 4. Alternative Attendance Accounting Method- Non-classroom and On-line classes • 5. Noncredit online
Why is this Important?? • Please pay attention to how the manner of scheduling impacts the FTES generated. • It is a big deal financially!
1. Census Week • These are classes that meet on a regularbasis each week for the full semester. Students are counted on enrollment, not attendance, during census.
FTES – Weekly Census Formula • Full Term—Calculated at Census (20% of Term Length) • Even though you don’t meet for them, holidays count in this method, but what about pedagogy?? • Formula - WSCH (WCH X Number of students) X Term Length Multiplier 525
FTES—CENSUS WEEKLY EXAMPLE • Class of 35 students meeting 75 minutes per day twice a week (150 minutes divided by 50 minutes is equal to 3.0 WCH) for 17.5 weeks (Standard Term Length Multiplier) • Formula - 105 WSCH (3 WCH x 35 Students) X 17.5 525 3.5 FTES
2. Daily Census • This includes classes that meet on a regular basis for at least 5 days, but do not meet the full semester. • Enrollment is counted on each course’s individual census day (20% of course). • Summer, short-term courses, and Intersession are included here. • The formula - DSCH (DCH X the number of students at census) x the number of days the class meets 525
FTES—CENSUS DAILY EXAMPLE • Class of 35 students meeting 90 minutes per day (1.8 DCH) with 29 class meetings (6 weeks, 5 days per week, 1 holiday): • Formula - 63 DSCH (1.8 DCH x 35 Students) X 29 Class Meetings 525 3.45 FTES
Special Considerations with Summer (Daily Census) • Can count in either year (class by class) IF . . . . . . . • Census day is in one year and end date in another. • Give yourself flexibility by scheduling this way. • Meetings need to occur with President, and Executive staff to make the decision of how to prepare the 320 report
3. Positive Attendance • Actual hours of attendance are counted. If a student is in attendance they count. If not, they do not. • Every 525 hours counts as one FTES. • Included are: • Irregularly scheduled credit courses • Open entry/open exit • In-service academy classes • Non-credit classes • Apprenticeship classes • Tutoring courses
FTES—POSITIVE ATTENDANCE FORMULA Total Actual Attendance Hours 525
FTES – Positive Attendance Class of 35 students meeting a total of 3 hours per week (3.0 WCH) for 17.5 weeks) (not part of the formula, but for illustrative purposes, let’s pretend that 70% of the students stay in the class from the first day to the last day). 1,837.5 Hours (35 X 3.0 X 17.5) X 70% 525 2.45 FTES
Positive Attendance (PA) is counted in the semester of the last class meeting, even if a majority of the class met during a previous semester.
4. Alternative Attendance Accounting Method • This is used for work experience, and independent study.
Use one of two methods to calculate: • Weekly Census formula for classes that meet the same as those held during the regular term • Daily Census formula for all others
How are online courses reported ? • Any appropriate method can be used.
5. Noncredit Distance Education • Sum of the total hours, plus expected hours for out-of-class work, plus hours of instructor contact all divided by 54. • Then, multiple by the number of students enrolled as of census, and multiply by 17.5
Noncredit DE has two census dates 1. 20% of class 2. 60% of class • Then compute the average of those two dates and divide by 525
How is All of This Reported to the State?? • Report is for entire district • It represents almost the entire income for EVERYTHING at the colleges and the district.