Download

1 / 11
110 likes | 229 Views
LESSON 3: Using Bioinformatics to Study Evolutionary Relationships. PowerPoint slides to accompany Using Bioinformatics : Genetic Research. Microbiologist Lalita Ramakrishnan, MD, PhD. Place of Employment: University of Washington Type of Research: Tuberculosis infection

E N D
LESSON 3: Using Bioinformatics to Study Evolutionary Relationships PowerPoint slides to accompany Using Bioinformatics: Genetic Research
MicrobiologistLalita Ramakrishnan, MD, PhD Place of Employment: University of Washington Type of Research: Tuberculosis infection Model Organism: Zebrafish Zebrafish are naturally susceptible to tuberculosis. Because their genes are fairly easy to manipulate, we can create some zebrafish that are susceptible to TB and some that are resistant to TB. Zebrafish are also good model organisms because they are transparent, so we can watch the infection process develop.
Comparing DNA Sequences Example: Genetic Testing using BLAST A T A G C T G Reference BRCA1 Sequence Query Sequence(s): Patient 1 A Look formutationsor changes relative to Reference Sequence A C Patient 2 Patient 3
Comparing DNA Sequences Example: Genetic Testing using BLAST Reference BRCA1 Sequence A T G G T G C A T A G C T G Query Sequence(s): Patient 1 Papaya Look formutationsor changes relative to Reference Sequence Look forchanges relative to each other Grape A Patient 2 A C Patient 3 Example: Multiple Sequence Alignments Using JalView and ClustalW A T G C T G C A T G C A G C Tomato A T G G A C A Watermelon The amount of change among the sequences reflects the evolutionary relatedness of the organisms. Image Source: Wikimedia Commons.
Pairs of Sequences are Compared to Each Other Papaya: ATGGTGCCG Grape: ATGCTGCCG Grape : ATGCTGCCG Watermelon: ATGGACACG Grape : ATGGTGCCG Tomato: ATGGTGAAG Papaya: ATGGTGCCG Watermelon: ATGGACACG Tomato : ATGCAGCCG Watermelon: ATGGACACG Papaya : ATGGTGCCG Tomato: ATGCAGCCG Number of Nucleotide Differences: Papaya Grape Tomato Watermelon Papaya 0 1 2 3 Grape 1 0 2 4 Tomato 2 2 0 3 Watermelon 3 4 3 0 Image Source: Wikimedia Commons.
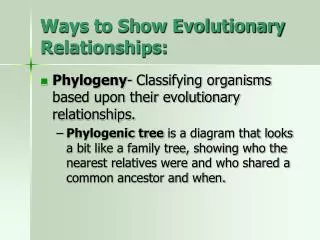
Phylogenetic Trees Reflect Evolution External Nodes Internal Nodes (Common Ancestors) Image Source: Wikimedia Commons.
Phylogenetic Trees: The CarnivoresRelatedness of Major Carnivores Domestic Cat Felis catus Cats Cat Branch Civets Mongooses Spotted Hyena Crocuta crocuta Hyenas Internal Nodes (Common Ancestors) Canids Bears Dog/Bear Branch Red Pandas Gray Wolf Canis lupus Skunks Weasels Raccoons Seals Raccoon Procyon lotor Fur Seals Sea Lions Walruses Adapted from : “WhoZoo: Images and Information about Animals at the Fort Worth Zoo.” http://www.whozoo.org/mammals/Carnivores/carnivorephylogeny.htm. Developed in part from mitochondrial sequence data from Arnason, et al. Mammalian mitogenomic relationships and the root of the eutherian tree. PNAS 99 (June 11, 2002): 8151-8156. Images Source includes Wikimedia Commons.
Phylogenetic Trees: Infectious Disease Pandemic H1N1 Influenza (“bird flu”) Internal Nodes (Common Ancestors) Pandemic H1N1 2009 ‘Spanish Flu’ H1N1 1918 California/7/2009 California/4/2009 Mexico/4/2009 New York/1/1918 South Carolina/1/1918 Puerto Rico/8/1934 Denver/1/1957 Brisbane/57/2007 Solomon Islands/3/2006 New Caledonia/20/1999 Scale: ‘Seasonal Flu’ H1N1 0.08% different Adapted from: Zimmerman SM, Crevar CJ, Carter DM, Stark JH, Giles BM, et al. (2010). Seroprevalence Following the Second Wave of Pandemic 2009 H1N1 Influenza in Pittsburgh, PA, USA. PLoS ONE 5(7): e11601. doi:10.1371/journal.pone.0011601. Influenza Image Source: Wikimedia Commons.
Phylogenetic Trees with an Outgroup Provide a Point of Reference Outgroup: Laminaria (brown algae) Tomato Grape Papaya Watermelon Image Source: Wikimedia Commons.
MicrobiologistLalita Ramakrishnan, MD, PhD Place of Employment: University of Washington Type of Research: Tuberculosis infection Model Organism: Zebrafish Zebrafish are naturally susceptible to tuberculosis. Because their genes are fairly easy to manipulate, we can create some zebrafish that are susceptible to TB and some that are resistant to TB. Zebrafish are also good model organisms because they are transparent, so we can watch the infection process develop.
CAREERS IN SPOTLIGHT:Microbiologist What do they do? Microbiologists study microbes: bacteria, viruses, fungi, and protists. Dr. Ramakrishnan is an expert in tuberculosis, a type of bacteria that infects almost a third of humanity worldwide. She also studies immunology, including the body’s reaction to or defense from microbes. What kind of training is involved? Most Microbiologists who run their own lab have a Bachelor’s degree and a PhD (which is usually 5–6 years of research training). However, each lab often employs scientists with diverse backgrounds, including people with Associate’s, Bachelor’s, and Master’s degrees. What is a typical salary for a Microbiologist? Associate’s degree: $35,000/year ($17.50/hour) PhD, Full Professor: $100,000/year or more ($48.00/hour) Source: Bureau of Labor and Statistics