Download
1 / 20
200 likes | 329 Views
B Tagging at High p T. at the Tevatron. TeV4LHC Feb 5, 2005 Plenary Sessions. Gordon Watts University of Washington Seattle. A DØ bias…. σ (W → l ν ). σ (tt) m t =175 GeV. Why Tag?. Much of Tevatron High p T program involves signals with b-quarks. Top, Higgs. (not possible before…).

E N D
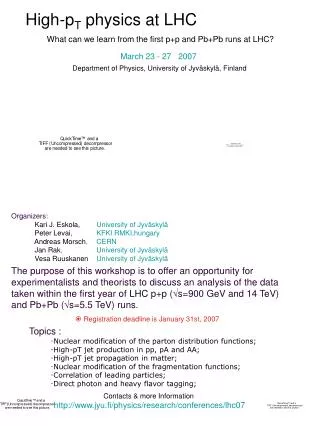
B Tagging at High pT at the Tevatron TeV4LHC Feb 5, 2005 Plenary Sessions Gordon Watts University of Washington Seattle A DØ bias…
σ(W→lν) σ(tt) mt=175 GeV Why Tag? Much of Tevatron High pT program involves signals with b-quarks Top, Higgs (not possible before…) S:N can be 50:1 per-jet
Why Talk About This? Why is this different from electron ID? Error on PV Algorithm Is Complex s~0.003 cm (MC) Built on Tracking and Vertexing (primary vertex) Both must be well characterized! S:B Determination is Hard Don’t have an equivalent clean sample of Zee. Have to guess b quark content! Decay Length It is Still New 1cm Certainly for DØ, less so for CDF.
Tagging Analysis Data MC Background/Signal Apply Selection Cuts Apply Selection Cuts Analysis applies b-tagging two ways… Apply b-tagging Calculating b-tagging probability Driven by measuring efficiency on data, not MC!! Background/Signal Estimation Final Data Sample
Operating Points Different Analyses are Optimal with different S:B Ratios An analysis requiring 2 tags may be able to do two “loose” tags rather than two “tight” Operating Points Many tagging algorithms provide a continuous variable. Operating points cut on these variables Tight: 0.3% Fake Rate (e ~ 45%) Medium: 0.5% (e ~ 50%) Loose: 1.0% (e ~ 60%) Some analyses have requested even larger background rates
What is Tagging? Type “b tagging” into Google… ATLAS b-tagging Group First hit!
Tagging a B • B Mesons • Has finite life time • Travels some distance from the vertex before decaying • ~ 1mm • With charm cascade decay, about 4.2 charged tracks Vertex Tagging a B B Impact Parameter (d) Decay Lengh (Lxy) Hard Scatter Impact Parameter Resolution d/s(d) Several algorithms under active development Decay Length Resolution Lxy/s(Lxy)
CSIP Algorithm Counting Signed Impact Parameter Per Taggable Jet Rates Measured in Data! Based on Impact Parameter Significance S(IP) = IP/s(IP) Jet axis Track 40% q I.P Primary vertex Requirements to tag a jet: - at least 2 tracks with S(IP) > 3 - or at least 3 tracks with S(IP) > 2 0.5% Light Quark Fake Rate
JLIP Algorithm Jet Lifetime Impact Parameter Based on Impact Parameter Significance • Probability distributions • P(Track from PV) • Defined for each class of tracks • # of SMT Hits, pT, etc. 40% Each jet assigned P(light quark) 0.5% Light Quark Fake Rate
SVT Algorithm Secondary Vertex Tagger Reconstruct Vertices using displaced tracks Cut on Decay Length Significance S(Lxy) = Lxy/s(Lxy). 40% 0.5% Z axis
Why 3? Detector Startup JLIP and SVT are strongly dependent on excellent tracking. CSIP is designed to be simple to understand Not 100% correlated Possibility to combine and increase S:B separation. Group Strength Competition But important they render results in similar format Ian-style speech…
Correlation mu+jets data sample 70% Correlated (signal) 30% Correlated (fake) Uncorrelated on background, correlated on signal Different Taggers Working on combining taggers
Estimating The Signal/Background Measure b-tagging efficiency on data, but wish to apply in MC or other non-b-quark data sample. Determine efficiency vs. jet pT, h, etc., on data, and use as lookup table in MC. Method 1 (top) Determine MC-to-data tagging ratio vs. jet pT, h, etc., on data, and use as lookup table applied to tags found in MC. Method 2 (Wbb) Both require determining, in Data, the eff of a standard b-jet and matching it to MC jets Use data sample with same flavor content of sample you are interested in, and derive tagging function (pT, h, etc.) and apply directly. Method 3 (hbb)
Not Easy Populating these tagging functions in pT, h, etc. takes millions of events of a known b-content! Systematic Errors: b content, MC sizes, JES (MC/Data)
Object Certification (e, m, jet, etc.) Attempt to avoid different physics cuts coming up with a slightly different “electron” Selection Cuts e on standard samples Reduce duplication of effort Make standard objects to speed use in new analyses. Background Rates Certified objects are reviewed by a committee Documentation
bID Certification The algorithms, operating points, tag-rate-functions Determining these things takes about 2 months with experienced people B-tag based analyses need this before they can proceed with background estimation Critical Path! (conference deadlines, etc.) Once certified, other analyses can quickly include b-tagging Win: Centralize processing of those millions of events, determining fake rate and efficiency.
b-ID Certification Certification Frequency Tracking Jet Energy Scale Primary Vertex Finding b-tagging Algorithm itself Force a re-certification Practically: 1.5 times a year Needs to be automated N.B. One of the things that slows us down the most is waiting for good quality data samples
Data/MC Scale Factor SVT: Tight Due mostly to Tracking Scale MC Data Tracking much more efficient in MC Noise in MC much smaller than in data
Charm Tagging Rate Use MC Ratio Charm Tag Rate pT Systematic Errors caused are directly proportional to MC size and simulation! Some physics channels can have distributions changed by charm tag rate. Bottom Tag Rate Need to determine directly pT
Conclusions • Backbone of may of the most important analyses at the Tevatron • Determining the algorithm is 50% of the work the first time, 20% for subsequent certifications! • Three tagging algorithms • Differences provide for competition and cross checks. • Using b-tagging in an analysis is complex • Systematic Error treatment (not discussed) • b-tagging group supplies the TRFs and algorithms • Fast pickup by other analyzers • Proper Efficiency Determination Difficult • Lack of clean bottom sample. Top @ LHC?