Download
1 / 73
730 likes | 930 Views
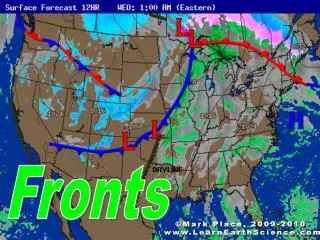
CSTAR Investigation Carolina Coastal Fronts. October 16, 2003 K. Wyat Appel Keith Contre Allen J. Riordan Department of Marine, Earth, and Atmospheric Sciences North Carolina State University. Schematic Example of a Coastal Front. Role of the Gulf Stream. Provides Thermal Contrast

E N D
CSTAR InvestigationCarolina Coastal Fronts October 16, 2003 K. Wyat Appel Keith Contre Allen J. Riordan Department of Marine, Earth, and Atmospheric Sciences North Carolina State University
Role of the Gulf Stream • Provides Thermal Contrast • Gulf Stream structure may influence CF development
Coastal Front Case Study • Coastal Front of 29-30 March 2001 • surface analysis every 6 hours from 0300 UTC 29 March to 0900 UTC March 30 • temperature analysis every 2C • sea-level pressure analysis every 2 mb • Highlights some of the difficulties forecasters encounter with coastal fronts
Was it a Typical Case? • Which fronts move ashore? • Can we differentiate? • What changes accompany FROPA? • Temperature • Wind Direction • Precipitation • Can models be improved?
Compositing • Composting • Compositing
Data Sources • National Data Buoy Center (NDBC) • buoy 41001 • buoy 41002 • SAMSON (from NCDC) • 1961 -1990, 1990-1995 • Cape Hatteras, Wilmington • Raleigh • NCEP reanalysis data (composites)
Offshore Coastal Front Detection Detection based on wind speed, wind direction, and temperature Detection Pairs Cape Hatteras / 41001 Wilmington / 41002
Missing Buoy Data • One or the other = 44 % • Both buoys missing = 3% • Missing data not distributed evenly • Complicated coastal front detection • Seasonal comparisons limited
Composite Overview • Used NCEP reanalysis data • Resolution • Spatial 2.5° by 2.5° • Temporal: every 6 hours • Students’ t test • Large, Synoptic features
Algorithm Results • 432 coastal front events found from 1984 – 1994 • Fronts were classified according to behavior • 103 Offshore fronts 83 cold season 20 warm season
Algorithm Results • 432 coastal front events found from 1984 – 1994 • Fronts were classified according to behavior • 73 Onshore fronts 68 cold season 5 warm season
Algorithm Results • 432 coastal front events found from 1984 – 1994 • Fronts were classified according to behavior • 256 Diurnal fronts 127 cold season 129 warm season
Algorithm Results CAD was not always present
Composite Comparisons(24 hours before onset) Onshore Offshore
Composite Comparisons(24 hours before onset) Onshore Diurnal
Composite Comparisons(12 hours before onset) Onshore Offshore
Composite Comparisons(12 hours before onset) Onshore Diurnal
Composite Comparisons(onset) Onshore Offshore
Composite Comparisons(onset) Onshore Diurnal
Composite Comparisons(12 hours after onset) Onshore Offshore
Composite Comparisons(12 hours after onset) Onshore Diurnal
Composite Comparisons(24 hours after onset) Onshore Offshore
Composite Comparisons(24 hours after onset) Onshore Diurnal
Summary Significant Discriminators • Onshore • Onshore Surface Vg • Sfc Low in NW Gulf • Deep Upper Trof • Offshore • Coast-Parallel Vg • Ridge in NW Gulf • Shallow Transient Trof
Answer: Onshore
Answer: Offshore
Answer: Onshore!
Future Work • Composite on Finer Scale • Especially CAD Erosion • Add Precip Climatology • Suggestions?