Download
1 / 19
190 likes | 302 Views
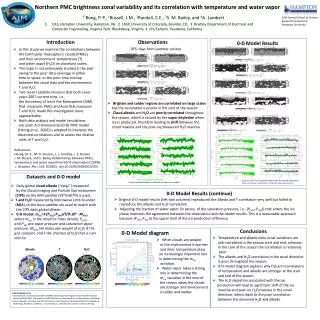
Correlative Analysis of PMC Existence and Mesospheric Temperature and Water Vapour. A.G. Feofilov 1,2 , S.V. Petelina 3 , A.A. Kutepov 1,2 , W.D. Pesnell 1 , and R.A. Goldberg 1. 1 – NASA GSFC, Greenbelt, MD, USA 2 – Catholic University of America, Washington, DC, USA

E N D
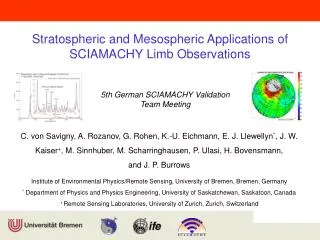
Correlative Analysis of PMC Existence and Mesospheric Temperature and Water Vapour A.G. Feofilov1,2, S.V. Petelina3, A.A. Kutepov1,2, W.D. Pesnell1, and R.A. Goldberg1 1 – NASA GSFC, Greenbelt, MD, USA2 – Catholic University of America, Washington, DC, USA 3 – La Trobe University, Victoria, Australia LPMR workshop, Stockholm, Sweden, July 12 – 15, 2009
Outline • General idea: trace the PMC/T/H2O correlations • Instruments: OSIRIS/Odin and SABER/TIMED • “Climatological” and “instantaneous” approaches • Coincidence criteria for instantaneous profiles • Separating the tangent-point from near/far field observations • PMC – mesopause temperature correlations • PMC – water vapor correlations • Conclusions
Water vapor, temperature and PMCs Tfrost Water vapor Precipitatingice particles Sublimated ice = enhanced H2O
The OSIRIS Instrument Aboard the Odin Satellite Odin satellite: polar, sun-synchronous, near terminator ~600 km orbit. Scan modes: 6–60 km, 6–100 km, and 60–100 km.Operates since 2001. OSIRIS: Optical Spectrograph and InfraRed Imager System. Spectral range: 280–810 nm Spectral resolution: 1 nm Exposure time: 2–5 s Vertical resolution: 1.3–2 km (mesospheric scan mode)
The SABER Instrument Aboard the TIMED Satellite TIMED: Thermosphere, Ionosphere, Mesosphere Energetics & Dynamics 74.1° inclined 625 km orbit; Latitudinal coverage: 83°S–52°N / 53°S–82°N Data available since 25 January 2002 • SABER: Sounding of the Atmosphere Using Broadband Emission Radiometry • Limb scanning infrared radiometer (~10–100 km, ~2 km footprint) • 10 broadband channels (1.27–17 µm) • Products: kinetic temperature, pressure, CO2, O3, H2O, NO, O2, OH, O, H
Two approaches • “Climatological”: establish the correlations betweenlong-term zonal averages. • “Instantaneous snapshot”: search for nearly simultaneous common volume measurements andcompare instantaneous profiles.
Climatological approach • Zonal averages of T and PMCs. H2O not included. • 6 latitudinal “belts”: 55S–65S, 55N–65N, 65S–75S, 65N–75N, 75S–85S, and 75N–85N. • Tracing correlation of: - mesopause temperature vs PMC occurrence rate - mesopause altitude vs PMC peak height • Daily averages with 7 day sliding window smoothing
Preliminary discussion #1 • Clear anti-correlation between the Tmesop and PMC occurrence rate. • A unusually warm polar mesospheric summer 2002 is better traceable in PMC occurrence rates at 65N–75N. • Averaged (Tmesop vs PMC occurrence rate) correlations for NH and SH overlap at temperatures above 132 K. • At lower temperatures the saturation in NH is reached at ~123 K while in SH it is reached at ~126 K mesopause temperature.
Preliminary discussion #2 • Summer mesopause altitude in NH is ~1.5 km lower than that in the SH. • Qualitative correlation between the mesopause altitude and PMC peak height. • The latitudinal variability of mesopause altitude in SH is smaller compared to NH. • The magnitude of PMC height variation is typically less than that of the mesopause. • PMC altitudes usually increase at lower latitudes whereas mesopause altitudes increase when moving towards the pole. NH SH
Instantaneous profiles comparison approach:coincidence criteria and profile selection • “Overlapping weight”: = t × 4 + ×5 + × 1 +6 / ( 90 z ) • Excluding the scans with: t > 1 hour, > 4, >20, z > 89 • 1083 overlapping measurements in 2002–2008. • Additional filtering: near/far field PMC observations and “invisible” PMCs (not observed or non-existent).
Near/far field and tangent point PMCs 100 km along the line-of-sight: 1km200km: 4 km vertical offset
Filtering out the profiles 1083 nearly simultaneous common volume measurements PMCs were observed in 522 of 1083 cases Tangent point PMCs were observed in 268 of 522 cases 268 cases in 2002–2008 to work with
Conclusions • Correlation between Hmesop and PMC height. • Anticorrelation between Tmesop and PMC occurrence rate. • Significant number (~50%) of PMC observations come from near/far field – important for future analysis. • Correlation between integrated height of (T<Tfrost) area and PMC brightness. • Correlation between PMC brightness and H2Oundercloud/H2Ocloud is a signature of freeze-drying effects and cloud sublimation.