Download
1 / 36
390 likes | 672 Views
Mortgage Default and Underwriting. Objectives Causes of Default House Price or Put Option Theory Income Theory Trigger Event Theory Quantifying Default Risk Probability of Default– Incidence Loss in the Event of Default Managing Default Risk Before the Loan is Made Underwriting

E N D
Mortgage Default and Underwriting • Objectives • Causes of Default • House Price or Put Option Theory • Income Theory • Trigger Event Theory • Quantifying Default Risk • Probability of Default– Incidence • Loss in the Event of Default • Managing Default Risk • Before the Loan is Made • Underwriting • After Default Occurs • Loss Mitigation • PMI Insurance • Credit Scoring and loan level pricing
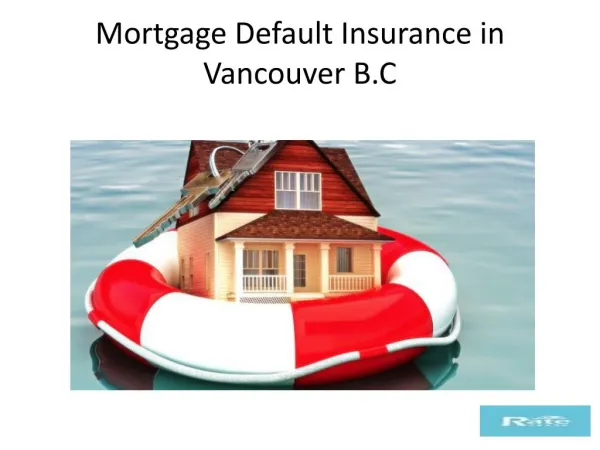
Default • Causes of Default : • House Price Theory (Strict Put Option View) • Borrowers default when house prices decline enough below market value of loan payments to outweigh “other” costs • Income Theory • Borrowers default when they lose jobs, become ill, divorce etc. and can no longer make payments • Trigger Event Theory • Borrowers default when some “trigger event” like job loss, divorce or a job move AND upon analysis of their situation they find their house price is less than the loan amount
Quantifying Default Costs • Lenders analyze default costs using two factors: • The probability of default : incidence • The loss in the event of default: severity • For “plain vanilla” residential mortgages; • Incidence is 2%- 4% • Severity: 15%-25% ignoring interest expenses • 25%-40% including interest expenses • Expected Loss : ~1% • For Commercial Mortgage Loans • Incidence is much higher: 10-15% • Severity is about the same: roughly 40% • Expected Loss: 5-6%
Managing Default Risk • Mortgage lenders have traditionally used a two-pronged attack on default risk. • Underwriting loan applications to screen out bad risks before loans are made • Insurance for remaining default risk • Mitigating losses after the fact via “workout” efforts • Loan modifications • Quick efficient processes • Loan level pricing is an alternate approach that is gaining favor • See MYFICO web page • FHA Proposed Changes
Underwriting Loans • The Three “C”s of Underwriting • Capacity • Payment to Income ratios • DSCR ratio for Commercial Loans • Cash to close the loan • reserves • Credit • Track Record and Willingness to Pay • Credit reports • FICO scores • Collateral • LTV ratios
Capacity • Residential lenders calculate two standard ratios to help them determine a borrower’s capacity to make the required payments • Housing payment to income ratio (Front end ) • Generally, no more than 28% - 38% of borrower’s pretax income can be devoted to making housing payment (“PITI”) • Total obligations to income (Back end) • Generally, no more than 33% - 40% of borrower’s income can be devoted to fixed obligations (PITI+ car loans, student loans, alimony etc.)
Capacity • Mortgage Journal Handout reports each lender’s underwriting ratios • 30 yr FRM • “Tightest” CT Mortgage, Webster and 8 others 28/36 • Common 33/38-45 • Most “lenient” Fairfield Mortgage 40/40 • There have been instances of 50/50 • Traditional ARMs with teasers • Underwriting practices can vary from lender to lender • Many underwrite at teaser rate if teaser <2% from FIAR • Generally somewhat tighter standards but 28/36 is common • Some underwrite at second year payment • Assuming no change in index • Some (few) underwrite at fully indexed rate. • Recent Regulations, that apply only to “nontraditional” loans require federally chartered lenders and their subsidiaries to “include an evaluation of the their (borrower) ability to repay the debt by final maturity at the fully indexed rate” • Also required to take into account expected negative amortization
Capacity • Freddie’s AUS (Section IV) adds Risk Units for Back End Ratio (Total Fixed Obligations to Income) > 32.6% • Ranges from 2 to 30 Risk Units • 30 Risk Units for back end ratios > 50% • Reject if applicant has more than 18 Risk Units • Adds more Risk Units if the “spread” between the two ratios is more than 10%. • For Example, an applicant with a front end ratio of 28% and a back end ratio of 45% would be assigned 18 Risk Units • Another applicant with a front end ratio of 38% and a back end ratio of 42% would receive 7 Risk Units • A Third Applicant with a front end ratio of 40% and a back end ratio of 40% would receive 4 Risk Units • Freddie’s System clearly emphasizes total debt ratio over the housing payment ratio
Capacity • There is not much empirical evidence supporting the view that income matters a whole lot in default. • Standard lending practices make this difficult to test. • Lenders screen the population to those with proven capacity to pay. • See Avery, Bostic, Calem and Canner Federal Reserve article (page 633 and table 6) • See also my own research
Traditional Example • Assume a couple with the following attributes • Total joint income: $80,000 /year • Purchasing a property worth $300,000 • Applying for 80% LTV loan of $240,000 • 30 year fixed rate • 6.5% rate • Estimated taxes: $5500/year • Estimated Insurance: $1000/year • Payment on student loans: $400/month • Car payments/leases: $400/month
Traditional Example • Front End Ratio: • Monthly income: 80,000/12=6,666.67 per month • Monthly P&I payment: 1516.96 • Monthly Taxes: $6500/12=541.67 • Front end ratio=(541.67+1516.96)/6,666.67=30.9% • Back End Ratio: • Denominator is the same: 6,666.67 • Numerator is now PITI + Other Fixed Obligations • (541.67+1516.96+400+400)=2858.63 • Back End Ratio=42.8% • This couple is at the high end of the “common” ratios • Will probably get through with good credit and LTV of 80% • FHLMC risk units: 10 for high debt to income ratio and 2 for the “spread” between the two ratios • Only has 3 risk units left for everything else.
Capacity • Lenders try to estimate and verify “stable” income • W-2 statements, Form 1040 and written employer verification • Non wage income presents challenges for lenders • Tips, investment profit, self employment income • Freddie System penalizes self employed, and borrower’s dependent on commissions and or tips. (See Section II) • Lenders may require that you have savings over and above your downpayment to be able to make the first few payments on the loan. • Cash Reserves • For example, the “Gold Measure Worksheet” adds Risk Units if the borrower has less than 2 months payments in the bank and deducts Risk Units if the borrower has reserves in excess of 4 monthly payments
Credit • The second C is credit history • Lender will order a copy of your credit report from one of the three major credit bureaus • Creditors rate your past borrowing from 1 (“Paid as agreed”) to 9 (“written off”). • Traditionally mortgage lenders had a human underwriter review credit reports and make a judgement. • FICO (or Bureau/Bankruptcy) scores • A FICO score is a numerical summary measure of your credit history. • Low scores--- bad history • High scores --- good history • Freddie Mac assigns Risk Units based on FICO Score • Ranges from -16 RU for 790 and above to 32 RU for 540 or less
Credit Scores Fair Isaac has proprietary system for generating scores based on past credit records Based on: Past Credit Payment History ---35% How Much Debt ---30% Length of History ---15% New Credit ---10% Mix of Sources of Credit ---10% Rough Indication of how score is generated is provided on Gold Measure Worksheet (Credit File B)
Credit History Issues • There is strong evidence from consumer lending and more recently from mortgage lending that bad credit in the past is a good predictor of problems in the future. • The GSEs were leading proponents of using credit scores in mortgage underwriting • Avery, Bostic, Calem and Canner article provides evidence of relevance.
Credit Score Issue: Discrimination and Fair Lending • Current debate re: discrimination • Some argue that reducing the amount of human judgement in the lending decision will reduce discrimination. • “Decisions will be made “scientifically” • Others argue that using credit scores perpetuates discrimination in lending • If you can’t get credit because of discrimination, you can’t build up a good FICO score. • Credit Scores clearly are related to income and wealth • Credit scores seem to vary systematically with geography
Collateral • The third C refers to the collateral that is pledged as security for the loan. • Verify the value • Limit initial loan to value ratio. • Lenders will normally require an appraisal of the home you intend to buy. • Value= Lower of purchase price or appraised value • Increasingly, houses are valued using automated valuation models • Apply regression techniques to large amounts of data to predict house price as a function of house characteristics
LTV & Default Risk • Avery Bostic Canner & Calem Table 1
Bringing It All Together Historically, LTV ratio has been viewed as the primary predictor of default risk
Mortgage Insurance • Mortgage Insurance has been used to mitigate default risk since early this century • 1904: New York authorized formal mortgage insurance • Until the Depression, rising house prices offset chronic industry problems • low capitalization • questionable business practices • Little or no regulation
Mortgage Insurance • Government efforts to revive the housing industry led to the establishment by the Federal Housing Administration of the Mutual Mortgage Insurance Fund to provide insurance on FHA loans. • FHA limits the size of the mortgage it will insure • VA guarantees only a portion of the loan and is available only to veterans
Private Mortgage Insurance • Private Mortgage Insurance re-emerged in 1957 with the creation of Mortgage Guarantee Insurance Corporation (MGIC) • Private mortgage insurance guarantees only a fraction of the loan • Generally up to 30-35% of the loan amount • On a $100,000 loan, the PMI’s obligation to pay claims is capped at the stated percentage--e.g. $30,000
Mortgage Insurance • PMI and VA Provide Insurance that is “Capped” at an upper limit • FHA Provides “100%” Insurance • FHA limits the size of the loan that can be insured • “Standard Limit”: $200,160 (As of 2006) • Exceptions for “High Cost” areas • In Hartford area: $333,735 • In Fairfield area: $362,790 • Down Payment • VA: None required • FHA: 3%-5% minimum • PMI: 3%-20%
Mortgage Insurance • Underwriting Differences -- Measuring Capacity • FHA establishes strict limits for front and back ratios • 29%/41% • Conventional loan standards more commonly 28/38 • PMIs can set their own limits and generally conform to “secondary market standards” • VA uses “residual income” approach • Starts with gross income, deducts taxes, debts and PITI • Sets standards for residual
Mortgage Programs • One Big Difference: FHA & VA loans are fully assumable • “Conventional” loans are generally subject to Due-on-Sale clause
Government Programs v Conventional • VA Program pretty good deal for those who qualify, have limited funds for down payment and need a loan of about $240,000 or less • VA Guarantees 25% of loan with maximum VA payment of $60,000 • Above $240,000 lender may require down payment from veteran to keep effective LTV to approximately 75% • FHA loans are good for borrowers who have very limited funds for down payment and need “aggressive” ratios • Special programs for recovering neighborhoods, GPMs, etc • Current changes to program designed to make it more compettive with “sub prime” conventional. • Conventional loans are used by about 85% of the population