Download

1 / 30
310 likes | 461 Views
If...X+5 = $200. What does X =?. Applications of Linear Equations. Chapter 5. Learning Objectives. After completing this chapter, you will be able to:. Distinguish between fixed costs and variable costs. LO 1.

E N D
If...X+5 = $200 What does X =? Applications of Linear Equations Chapter 5
Learning Objectives After completing this chapter, you will be able to: Distinguishbetween fixed costs and variable costs LO 1. Perform linearCost-Volume-Profit and break-even analysis employing: LO 2. A. - The contribution margin approach B. - The algebraic approach of solving the cost and revenue functions Also C. - A breakeven chart
Learning Objectives Graph a linear equation intwo variables LO 3. Solve two equations in two unknowns by the graphical method LO 4. Express a linear equationin the slope-intercept form LO 5.
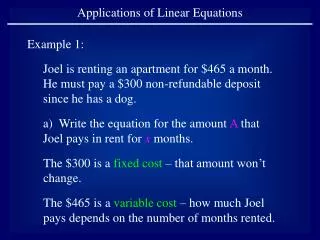
LO 1. Cost Analysis
Terminology Fixed Costs Business Costs Business Expenses or Variable Costs …do NOT change if sales increase or decrease e.g. rent, property taxes, some forms of depreciation …do change in direct proportion to sales volume e.g. material costs, direct labour costs
Terminology BreakEvenPoint … is the point at which neither a Profit or Loss is made
Terminology A Contribution Margin statement Contribution Margin …is the dollar amount that is found by deducting ALL Variable Costs from Net Sales and ‘contributes’ to meeting Fixed Costs and making a ‘Net Profit’. Contribution Rate …is the dollar amount expressed as a percent (%) of Net Sales
Terminology A Contribution Margin Statement $ % NetSales(Price * # Units Sold) x100 Less: Variable Costs x x Contribution Margin x x Less: Fixed Costs x x Net Income x x
Scenario 1 Q uestion: Market research for a new product indicates that the product can be sold at $50 per unit. Cost analysis provides the following information: Fixed Costs per period = $8640 Variable Costs = $30 per unit. Production Capacity per period = 900 units How much does the sale of an additional unit of a firm’s product contributetowards increasing its net income?
Contribution Margin Contribution Rate *BreakEven Point: ...in Units (x) ...in Sales $ ...in % of Capacity Formulae Applying Formulae - To Find - CM = SP - VC CR=CM/SP* 100% x =FC / CM $x =(FC / CM)*SP BEPin Units/PC*100 * At BreakEven,NetProfit or Loss = 0
Applying the Formulae As in the previous scenario, the new product can be sold at $50 per unit. Costs are as follows: Fixed Costs are $8640 for the period , Variable Costs are $30per unit, and theProductionCapacity is 900 units per period. CM = SP - VC = $50 - $30 = $20 CR=CM/SP* 100% = $20/$50 * 100 = 40% BreakEven Point: Unitsx =FC / CM = $8640/$20 = 432 Units In $ x =(FC / CM)*SP = ($8640/$20)* $50 = $21,600 BEPin units/ PC*100 = 432/ 900*100 = 48% of Capacity
Scenario 2 Q uestion: The Lighting Division of Seneca Electric Co. plans to introduce a new street light based on the following accounting information: FC= $3136VC= $157.SP= $185 Capacity = 320 units Calculate the breakeven point (BEP) …in units …in dollars …as a percent of capacity
Scenario 2 SP – VC = CM $185 – 157 = $28 FC= $3136VC= $157.SP= $185 Capacity = 320 units Break Even Point …in units =FC / CM = $3136/ 28 = 112 Units …in dollars =(FC / CM)*SP = ($3136/ 28) * $185 = $20720 …as a percent of capacity = BEPin units/PC*100 = 112/320 * 100 = 35% of Capacity
Scenario 2 -1 FC= $3136VC= $157.SP= $185Capacity = 320units $2688 Determine the BEP as a % of capacity if FC are reduced to $2688. Formula =BEPin units/PC*100 Step 3… Find % of Capacity Step 2… FindBEP in units Step 1… FindCM =BEPin units /PC*100 SP = $185 = FC/CM VC= - 157 CM $28 = $2688/$28 = 96/320*100 = 96 Units = 30% of Capacity =
Scenario 2 -2 $4588 Formula = BEPin units /PC*100 FC= $3136VC= $157SP= $185Capacity = 320units $148 VC =SP*80% = $148 Determine the BEP as a % of capacity if FC are increased to $4588, and VC reduced to80%ofSP. Step 3… Find % of Capacity Step 2… FindBEP in units Step 1… FindCM =BEPin units /PC*100 SP = $185 = FC/CM VC= - 148 CM $ 37 = $4588/$37 = 124/320*100 = 124 Units = 39% of Capacity
Scenario 2 -3 Formula = BEPin units /PC*100 FC= $3136VC= $157SP= $185Capacity = 320units $171 Determine the BEP as a % of capacity if SP is reduced to$171. Step 3… Find % of Capacity Step 2… FindBEP in units Step 1… FindCM =BEPin units /PC*100 SP = $ 171 = FC/CM VC= -157 CM $ 14 = $3136/$14 = 224/320*100 = 224 Units = 70% of Capacity
Scenario 2 -4 Formula NI = #Units aboveBEP*CM FC= $3136VC= $157SP= $185Capacity = 320units Determine the NI if 134 units are sold! Units Sold 134 BEP 112 OverBEP 22 Step 2… FindBEP in units Step 1… FindCM SP = $185 = FC/CM = $3136/$28 VC= - 157 CM $ 28 = 112 Units CM of $28 per unit Company had a NI of 22 * $28 = $616.
Scenario 2 -5 Formula #Units aboveBEP =NI/CM Step 2… FindBEP in units Step 1… FindCM SP = $185 = FC/CM VC= - 157 CM $ 28 = $3136/$28 = 112 Units FC= $3136VC= $157SP= $185Capacity = 320units What unit sales will generate NI of $2000? NI/CM = $2000/$28per Unit = 72 Units above Break Even CM of $28 per unit 72 Units + 112 BEP Units = Total Sales Units = 184
Scenario 2 -6 Formula # Units belowBEP =(NI)/CM Step 2… FindBEP in units Step 1… FindCM SP = $185 = FC/CM VC= - 157 CM $ 28 = $3136/$28 = 112 Units FC= $3136VC= $157SP= $185Capacity = 320units What are the unit sales if there is a NetLoss of $336? (NI)/CM = ($336)/$28per Unit = 12 Units below Break Even CM of $28 per unit 112 BEP- 12 Units Below = Total Sales Units = 100
Scenario 2 -7 Formula # units above BEP *CM = NI Step 2… FindBEP in units Step 1… FindCM SP = $185 = FC/CM VC= - 157 CM $ 28 = $3136/$28 = 112 Units FC= $3136VC= $157SP= $185Capacity = 320units The company operates at 85% capacity. Find the Profit or Loss. 320*.85 = 272 Units Production 272 BEP 112 OverBEP 160 CM of $28 per unit 160 Units * $28 = Profit $4480
Case The Marconi Co. year end operating results were as follows: Total Sales of $375000 Operated at 75% of capacity TotalVariable Costs were $150000 TotalFixed Costs were $180000 What was Marconi’s BEP expressed in dollars of sales?
Case The Marconi Co. year end operating results were as follows: Total Sales of $375000 Operated at 75% of capacity TotalVariable Costs were $150000 TotalFixed Costs were $180000 What was Marconi’s BEP expressed in dollars of sales? What information is needed to calculate the $BEP? 1. Number of Units sold 2. VCper Unit 3. CM 4. Total Costs 5. BEP in $
Case The Marconi Co. year end operating results were as follows: Total Sales of $375000 Operated at 75% of capacity TotalVariable Costs were $150000 TotalFixed Costs were $180000 What was Marchoni’s BEP expressed in dollars of sales? 1. Number of Units sold Let SP = $1 and X be the Number of $1 Units sold Sales of$375 000 = 375000 Total Units sold $150000 375000 2. VCper Unit Total VC Total Unit Sales = $0.40perunit = SP $1.00 VC .40 CM $ .60 3. CM
Case The Marconi Co. year end operating results were as follows: Total Sales of $375000 Operated at 75% of capacity TotalVariable Costs were $150000 TotalFixed Costs were $180000 What was Marchoni’s BEP expressed in dollars of sales? # Of Units = $300000 $BEP 4. Total Costs TC = FC + VC = $180 000 + 0.40X $BEP =(FC/CM)*SP 5. BEP in $ = ($180000/0.60)*$1.00 = (300000)*$1.00
Step 1 Rearrange the equation to solve for y Step 2 Substitute a few values for x, and calculate the corresponding values for y Step 3 Plot and connect the points on the xy graph Graphing a Linear Equation Graph the equation 3x – 2y = 8 over the range x=0 to x=8 LO 3 3x – 2y =8 – 2y = 8 - 3x y = 8 - 3x -2 y = 1.5x - 4 x y 0 -4 3 0.5 6 5 …continue
Step 3 Plot and connect the points on the xy graph Graphing a Linear Equation y = 1.5x - 4 x y 0 -4 3 0.5 7 6 5 4 3 2 1 0 -1 -2 -3 -4 6 5 y = 1.5x - 4 Y 0 1 2 3 4 5 6 7 8 9 10 X
Graphing a Linear Equation y = 1.5x - 4 This is called the slope–intercept form of this linear equation Where 1.5 is the slope, and -4 is the y-intercept 1 0 -1 -2 -3 -4 Y 0 1 2 3 4 5 6 7 8 9 10 y = 1.5x - 4 X
Step 1 Rearrange each equation to solve for y Step 2 Substitute a few values for x, and calculate the corresponding values for y in each equation y = 6 – 4x 2 Step 3 Plot and connect the points on the xy graph – the point where the lines cross in the point of intersection, your solution Solving 2 equations in 2 unknowns graphically LO 4 Find the point of intersection for the equations 3x – 2y = 8 and 4x+2y = 6 4x+2y = 6 y = 1.5x - 4 2y = 6- 4x y = -2x + 3 y = -2x + 3 x y 0 3 3 -3 2 -1
y = -2x + 3 x y Solving 2 equations in 2 unknowns graphically Find the point of intersection for the equations 3x – 2y = 8 and 4x+2y = 6 7 6 5 4 3 2 1 0 -1 -2 -3 -4 3x-2y=8 (2, -1) or y= 1.5x - 4 Y 0 3 0 1 2 3 4 5 6 7 8 9 10 3 -3 4x+2y=6 or y = -2x + 3 2 -1