Download
1 / 41
500 likes | 992 Views
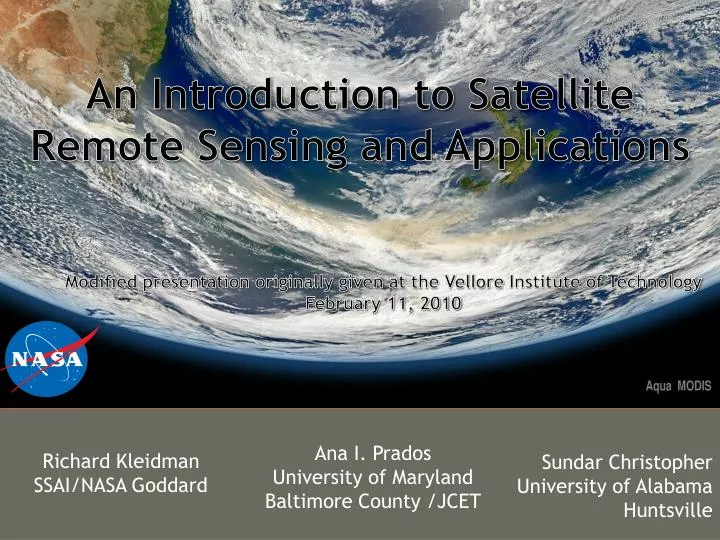
An Introduction to Satellite Remote Sensing and Applications . Modified presentation originally given at the Vellore Institute of Technology February 11, 2010. Ana I. Prados University of Maryland Baltimore County /JCET. Richard Kleidman SSAI/NASA Goddard. Sundar Christopher

E N D
An Introduction to Satellite Remote Sensing and Applications Modified presentation originally given at the Vellore Institute of Technology February 11, 2010 Ana I. Prados University of Maryland Baltimore County /JCET Richard Kleidman SSAI/NASA Goddard Sundar Christopher University of Alabama Huntsville
Today’s Talk • General Introduction to Remote Sensing and Satellite Instruments • A sample sensor - MODIS • A sample application – Air Quality
Why Satellite Remote Sensing? Advantages: • Repeated reliable measurements • Large spatial coverage • Numerous satellites are now in orbit Disadvantages: Expensive and need expertise to convert measurements to geophysical values such as temperature OMI
Satellite Capabilities • Are a function of: • Mission Design • Real World Physical Limitations • Cost • Current State of Technology
Technological Consideration in Remote Sensing Instrument Design - Resolutions • 4 major resolutions • Spatial resolution • Temporal resolution • Spectral resolution • Radiometric resolution
Resolutions and Trade Offs Due to real world limitations imposed by physics and costs a sensor cannot obtain extremely high temporal, spatial, spectral, and radiometric resolutions.
Remote Sensing – Resolutions • Spatial resolution • The smallest spatial measurement for an individual pixel • Spatial Coverage • The total geographic extent of the measurement • Temporal resolution • Frequency of measurement over the same location
Spatial Resolution IFOV FOV • Spatial Resolution : A simple definition is the pixel size that satellite images cover. • Satellite images are organized in rows and column called raster imagery and each pixel has a certain spatial resolution. Satellite height Nadirpixel size Off-nadirpixel size
Remote Sensing – Trade offs MODIS 1 KM True Color Reprojected Image 60 KM 2300 KM MODIS 500 Meter True color image Aster Image 15 M Resolution
Temporal Resolution How often data is obtained for the same area. Determined by: • Type and height of orbit • Size of measurement swath
Common types of orbits Geostationary orbit An orbit that has the same Earth’s rotational period Appears ‘fixed’ above earth Satellite on equator at ~36,000 km Polar orbiting orbit fixed circular orbit above the earth, ~1000 km in sun synchronous orbit with orbital pass at about same local time each day
Temporal Resolution and Orbit • Polar Orbiting Satellites - Twice daily (one daytime and one nighttime) • Geostationary Satellites - Hourly or sub hourly
Trade Offs • A sensor cannot obtain extremely high spectral, spatial and radiometric resolutions. • MODIS can obtain global coverage every one – two days because of its wide swath width. • Higher resolution polar orbiting satellites may take 8 – 16 days for global coverage or may never provide full coverage of the globe. • Geostationary satellites obtain much more frequent observations but at lower resolution due to the much greater orbital distance.
MODerate-resolution Imaging Spectroradiometer (MODIS) • NASA, Terra & Aqua • launched 1999, 2002 • 705 km polar orbits,descending (10:30 a.m.) & ascending (1:30 p.m.) • Sensor Characteristics • 36 spectral bands ranging from 0.41 to 14.385 µm • cross-track scan mirror with • 2330 km swath width • Spatial resolutions: • 250 m (bands 1 - 2) • 500 m (bands 3 - 7) • 1000 m (bands 8 - 36) • 2% reflectance calibration accuracy
250 M 500 M MODIS Reflected Solar Bands
Satellite Products • Product quality can range from excellent to poor depending on factors like: • Instrument capabilities • Instrument calibration and performance • The algorithms used to interpret the data • Real world physical limitations • Your intended use of the product Raw data which has been taken and interpreted to express a geophysical parameter. examples: Cloud fraction, particle size Often many assumptions and approximations are made to get from raw data to product.
AtmosphereLand Ocean MODIS Products are divided into three main categories Due to the size and variety of products there is no single source for information about the MODIS products.
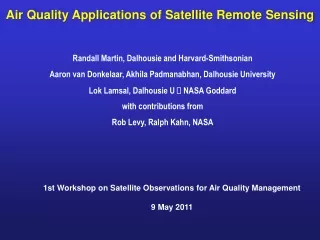
Things We Most Want to Know about Aerosols and Trace Gasses for Air Quality Applications. • Effects on Visibility • Transport over large distances • Concentrations at the ground • Trace gas concentrations at the ground • Identification of sources of aerosols/trace gasses • Wild fire identification
Can Satellites Provide the Information We Want? • For some things yes • For some things no • For some things not yet • For some things maybe never A Definite Maybe
You must understand any data set well to make proper use of the information!
Some of the information we want can be obtained simply by looking at true color imagery. • Visibility • Aerosol and trace gas transport over large distances • Aerosol concentrations at the ground (specifically PM) • Trace gas concentrations at the ground • Identification of sources of aerosols/trace gasses • Wild fire identification
True Color Imagery Visual representation of -dust -industrial pollution -smoke -plumes Successive images can be animated to show the transport of large aerosol events.
Primary Satellites for Air Quality Applications Aerosol Measurements: MODIS Sensors • Terra • 2000- Present • 10:30 AM daily local overpass • Aqua • 2002 - Present • 1:30 PM daily local overpass MISR Sensor • 2000 – Present • 10:30 AM local overpass but ~ every 4th day. Trace Gas Measurements: OMI Sensor (GOME, SCIAMACHY) • 2004 -Present • 1:30 PM daily local overpass
MODIS Capabilities • Measurement of total column aerosols with some ability to characterize the size the aerosol. • Fire detection – detection will depend on the radiative energy emitted by the fire. • Plume detection • Transport inventories – minimum resolution is probably on the order of 500 KM. • Land cover / land use change. MODIS can not detect aerosols below clouds
MODIS Capabilities - Aerosols Derives total column aerosols • This is a measurement of light attenuation as the photons travel through the atmosphere. • There is never a direct physical measurement of the aerosols. • The retrieval algorithm uses ancillary data, models and several assumptions to express total column aerosol as AOD • AODis a measure of the integrated column light extinction (unitless)
Spatial Resolution of MODIS AOD • Global product is created in 10 x 10 KM boxes • Next release will also have 3 x 3 KM resolution product • Easy data availability for analysis and display from Giovanni tool in 1 degree resolution • Easy data availability for display from NEO site in 0.25 degree resolution
Limitations of Satellite Data Passive sensors measure the entire column. Column measurements may or may not reflect what is happening at ground level. This is true whether we are measuring aerosols or trace gasses.
Relating Column Measurements and Ground Concentrations Ground Concentration = η· τ (AOD) Note this assumes first of all an accurate determination of AOD. Supplemental information from ground and space based instrumentation is essential in order to determine this relationship.
Relating Column Measurements and Ground Concentrations Estimated PM2.5 = η· τ (AOD) • vertical structure • aerosol type • meteorological effects • diurnal effects Some key factors we may need to know to accurately determine η Correlations vary from region to region as do the factors which have the greatest influence on η
Steps Which Can Be Taken to Improve MODIS -PM2.5Correlations • Tuning the MODIS AOD retrieval to local conditions. • Using ground instruments such as aeronet sun photometers • and lidars to determine the vertical distribution of the aerosol • Use of local meteorological data and models to determine • the height of the local planetary boundary layer. • Use of additional satellite data. • Use of forecast and numerical models.
Significant agreement with coincident ground measurements over NA Annual Mean PM2.5 [μg/m3] (2001-2006) Satellite Derived Satellite-Derived [μg/m3] In-situ vanDonkelar et. al. AGU 2009 In-situ PM2.5 [μg/m3]
GIOVANNI Web Based Tools http://giovanni.gsfc.nasa.gov • Many Giovanni Interfaces (“Instances”) • Each instance may have information from a single or multiple data source which can include satellite and ground based data • Easy data availability • Easy data analysis • For some applications a research level tool • For some applications an exploratory tool
GIOVANNI Demonstration Air Quality Instance http://giovanni.gsfc.nasa.gov
A Word From Our Sponsor Applied Remote Sensing Education and Training http://arset.gsfc.nasa.gov
True Color Imagery A fairly in-depth presentation of several sites for obtaining imagery and related information can be found at: http://arset.gsfc.nasa.gov/ Follow the link to “materials”. “Visually Exploring the Earth with NASA Satellite Data”