Download
1 / 28
280 likes | 297 Views
This research explores the use of self-organising maps (SOMs) to analyze and integrate data at local and global scales, addressing challenges in ecosystem understanding and improving human-environment relationships.

E N D
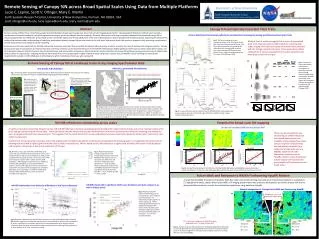
Self-organising maps for integrating data across multiple scales S Shanmuganathana, P Sallisa and J Buckeridgeb b Environmental and Oceanic Sciences Centre a Auckland University of Technology, New Zealand subana.shanmuganathan@aut.ac.nz
Summary of slides • Global environmental issues • Need for improved human-environment relationship • Challenges in ecosystem understanding • Need for new tools • Conventional data analysis methods • drawbacks • digital data • Artificial neural networks (ANNs) • Self-organising maps (SOMs) • SOMs in integrated analysis • local • global scales • across scales
Global environmental issues “We also know that 15 per cent of the world’s population accounts for 56 per cent of consumption and if everybody lived like they do we would need 2.6 additional planets to support us all…Our assessments of the state of the environment suggest we will need to innovate a transformation to sustainable production and consumption patterns in the space of just one generation”. (Shrestha 2003)
Global environmental issues • THE STATE OF THE ENVIRONMENT: PAST, PRESENT, FUTURE - Hard Facts • biodiversity loss • overexploitation of natural resources • deforestation … http://www.unep.org/Geo/press.htm
Biodiversity can be managed • “We know enough about the distribution of species and ecosystems to ensure that the world's biodiversity is managed effectively….Give nature half a chance, and it will take care of itself” http://news.bbc.co.uk/2/hi/science/nature/2166306.stm
Grand challenges of this era areas of ‘highest priority’ for focus within environmental sciences • Biological Diversity and Ecosystem Functioning: • Hydraulic Forecasting: • Infectious Disease and the Environment: • Land-Use Dynamics: interdisciplinary research • involving ecologists, ethnologists, psychologists, engineers, economists, planners, landscape architects, and others. • data needs, collection and synthesis of data requiring cooperation among physical, biological, and social scientists; engineers and planners; and other associated funding agencies. to protect biodiversity: Need for coordinated effort • hydraulic modelling • human management institutions on ecosystems. • climate change in ecosystem • urban long-term ecological research sites. - Graedel et al. (2001)
Need for new tools • humans ---> extensive damage to the environment • sustainable environmental development - remote • lack of proper ecosystem understanding • ecosystem functioning and biodiversity • ecosystems are complex • diverse • major challenge (Graedel et al. 2001) • new tools • integrated approaches • cross scale • using dissimilar data sets
Conventional methods • CM are complex rigorous, still unable to distinguish • human induced from natural environmental variations • Research of the 20th century • significantly contributing --- current environmental problems • the research became focused in gaining in-depth knowledge • with highly specialised scientific fields. • encouraged a fragmented image of nature - Bowler (1992). • responsible for altering the Earth’s natural flows and cycles • Digital data - experimentation of novel approaches • ANNs • AI
Source: http://hem.hj.se/~de96klda/NeuralNetworks.htm Artificial neural networks
needs step by step details of the problem and solution Solves laborious repetitive tasks applications Mathematical calculations payroll, cannot solve real world problems i.e. image/ voice recognition stores information as patterns- based on animal brain /nerve cell structure and functioning Neurons, architecture, training and recall algorithm Train - input/ output Heuristics -> computing applications image/ voice recognition character recognition Conventional Vs ANNs
Output layer Input layer Kohonen’s SOM (1982) • A feed forward neural network with unsupervised training al. • Displays the input vectors on a two D grid • Preserves the topology of the input vectors • Visual analysers, enables the detection of hidden patterns • Ideal data mining tool for knowledge extraction • Teuvo Kohonen - 1st modelled the human brain’s cortex cells Figure : Simplified diagrams of the human brain and a self-organising map (SOM)
SOMs in integrated analysis • New Zealand's annual gross domestic product (GDP) composition, with household consumption and housing patterns, from 1988 to 2001. • World Bank's rural development, GDP and biodiversity for year 1980 and 2000 • Ozone hole with green houses from 1979-2001
SOMs in national data analysis • Annual GDP composition • household composition • housing patters • separate house Vs flat/ apartments • cause indirect pressure on the environment
Annual GDP composition • Agriculture • forestry and logging • fishing • mining • manufacturing, • electricity • gas and water supply • construction • transport and storage other services • Unallocated
household composition • food and beverages • clothing and footwear • housing • household goods and services • health and medical goods and services • transport • leisure and education • hotels and restaurants and other goods and services
GDP, Household & housing Figure 1 a & b: SOM created with New Zealand's national GDP, household consumption and housing pattern data.
cluster 1 (1988-1991), cluster 2 (1992-1996) and cluster 3 (1997-2001). GDP from Agriculture, mining and other services increase manufacturing and unallocated categories decrease; unless measures to preserve habitat biodiversity is taken this is not a good trend household goods and services, and leisure and education increase. GDP through fishing, forestry and logging, education decrease. flat/ apartment dwelling and occupancy have increased. SOM results - national data
Growth of development variables agriculture, industry, manufacturing and services development Biodiversity Threatened mammals T. birds T. plants Forests area (sqk) SOMs in global data analysis
SOM - GD analysis • In cluster 1, China and Indonesia • highest threatened species rates -mammals and birds 2000. • highest GDP both periods with high industry & manufacturing • % of average annual deforestation for (1990/2000) - their GDP growth / the expense of biodiversity loss.
SOMs-ozone depletion gases c 1 (1981-84), c 2 (1985-88), c 3 (1989-95 and 1999) and c4 (1996-98 and 2000-01). ozone hole area/ minimum ozone - not proportionate to the total gases CFC 12 and 113 - contribute more Methane gas - remarkable increase since 1985.
SOMs in prediction • Reduction in CFC12 & CFC 113 (512.9, 80.88 total 2750) for 2000-2001 • CFC12 & CFC113 for 1996-1999 (525.7 and 82.06 total 2689) • All donot contribute the same towards O3 depletion • The high 2000-2001 total release might have caused from increased methane.
Acknowledgements • For details please contact subana.shanmuganathan@aut.ac.nz