Download
1 / 10
100 likes | 296 Views
Predicting finger flexion from electrocorticography ( ECoG ) data. Roberts Mencis. BCI competition. BCI competition IV, Berlin 2008 Subjects – epilepsy patients ECoG electrode grid implanted Dataglove from 5DT. Goals of project. Understanding neural basis of finger movement

E N D
Predicting finger flexion from electrocorticography (ECoG) data Roberts Mencis
BCI competition BCI competition IV, Berlin 2008 Subjects – epilepsy patients ECoG electrode grid implanted Dataglove from 5DT
Goals of project • Understanding neural basis of finger movement • In-depth analysis of data • Prediction model based on data analysis • Better or comparable result with current winners • I place - 0.46 • II place – 0.42 • III place – 0.27
Experimental setup 3 subjects Each experiment – 10 minutes 2 seconds cue, 2 seconds rest ECoG data from 48-62 channels Finger flexion data, 5 channels Sampling rate 1000 Hz
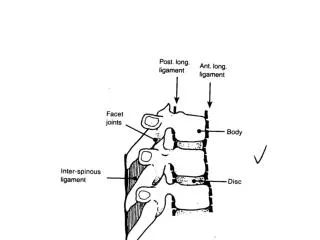
Neuroscience of finger movement Brodmann area 4 (primary motor cortex) Fingers – overlapping areas with hotspot for each finger, somatotopic arrangement Cora-and-surround organisation, typical movements together Small distance between neural hotspots (few mm)
Data analysis For most subjects&fingers at least on channel with 0.3-0.4 correlation between ECoG and finger flexion data
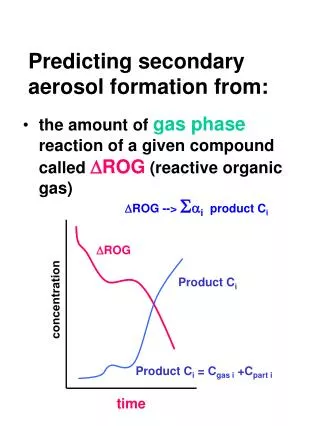
Data analysis Activity in frequency range 60-200 Hz corresponds to finger flexion (for some subjects&fingers) Subject #2, finger #1, channel #24, window size 1000 ms
Data analysis Subject #2, finger #1, channel #24, frequency 110 Hz, correlation 0.4058 Subject #2, finger #1, channel #24, best 20 frequencies, correlation 0.6869
Prediction model For each subject and finger – find best channel-frequency pairs with highest correlation between ECoG and finger flexion training data Determine top N channel-frequency pairs with highest scores whose combination gives best correlation on training data Use those channel-frequency pairs to predict finger flexion from test ECoG data Smooth predicted finger flexion data (moving average) Top channel-frequency pairs:
Way forward… • That could be done to improve results? • More advanced techniques for feature selection • Different machine learning algorithms • Making use of finger flexion data structure (differences between cue-rest phase; fact that generally only one finger is flexed simultaneously etc.) • More time and effort… THANK YOU FOR ATTENTION!