Download
1 / 25
260 likes | 436 Views
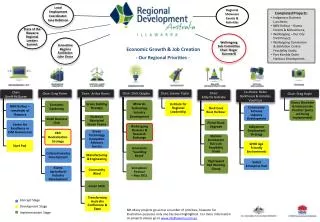
DRAFT. ETHEKWINI ECONOMIC DEVELOPMENT AND JOB CREATION STRATEGY. 11 SEPTEMBER 2012. Growing prospects; free trade area; gateways. Infrastructure, high costs & unemployment. Well developed economy & politics. Recession, unemployment & youth; break-out nations & Brics.

E N D
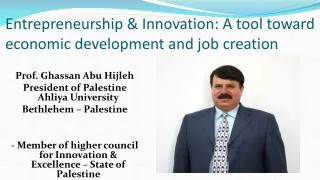
DRAFT ETHEKWINI ECONOMIC DEVELOPMENT AND JOB CREATION STRATEGY 11 SEPTEMBER 2012
Growing prospects; free trade area; gateways Infrastructure, high costs & unemployment Well developed economy & politics Recession, unemployment & youth; break-out nations & Brics
National Priority Corridor Provincial Priority Corridor Need for a regional approach
METRO COMPARISON: “eThekwini has the highest levels of poverty and most number of people on social grants along with largest household size, while having too few people employed. This has meant that there is a high level of dependency (a large household depends on 1 job). Income levels are low resulting in low levels of disposable income to spend on consumption goods. There is also a disproportionately high expenditure on propertyand travel, further eroding disposable income. Of particular concern is that eThekwini, while being home to the continents premier port, only ranks 4th in terms of net exports. Furthermore, while eThekwini has been the 3rd largest economy among cities in SA, according to current economic performance, Tshwane and Ekurhuleni may pass eThekwini by 2016, relegating it to no. 5 spot” In general the economic performance of the city is of great concern and unless urgent and ambitious programmes are put in place, supported by the prioritisation of economic growth and job creation, the social burden will increase to ultimately undermine the financial viability of the Municipality Our debt repayment as a %age of own revenue is highest among metros (National Treasury Sept 2011)
Key Regional Opportunities and Advantages Existing Key Plans: • IDP; SDF; LTDF • Informal Trade Policy Still to be finalised: • Back of Port Plan; Port Expansion & Dig-out Port • Spatial plans • Blue Sky • Integrated Rapid Public Transport Network • SMME Strategy • Freight Strategy and Route • Investment Policy and Strategy • SEZ Plan (in partnership with Province and DTI) • PORT • AFRICAN FREE TRADE ZONE • NATIONAL PRIORITY CORRIDOR • INFRASTRUCTURE EXPENDITURE • MANUFACTURING • TRADE DEVELOPMENT • DUBE TRADE PORT • LIFESTYLE AND WEATHER • TOURISM INDUSTRY AND HALLMARK EVENTS • BEE OPPORTUNITIES FROM INFRASTRUCTURE • NORTHERN CORRIDOR • KEY INDSUTRIAL SECTORS LIKE MARITIME & CHEMICALS • KEY FIRMS • TOWNSHIP DEVELOPMENT • POTENTIAL ROLE AS GATEWAY While there are massive challenges, eThekwini is also the city with the greatest opportunities, if it can realise its potentials
Key Challenges • Decision Making • Slow and often externally driven • Lack of priority • Consumption and Cost of Living effect • Low disposable income (low per capita; high hh size; high social burden; low participation rate) • High expenditure on property, travel & low on higher order goods • Too few quality rate payers & consumers • Private Sector Investment • Trade Development • Too few exports • Government Finances • High expenditure on social and low on economic • Balance between cost competitive environment for business & municipal finance • Business Friendly Environment: • Red tape add cost • Investor unfriendly • Bulk Infrastructure Limitations and Resources • Labour force • High unemployment, small labour force • Skills mismatch • Limited choice & high drainage of skilled labour • SMME Development • Poverty and Inequity • Income & spatial • Transformation We believe it’s the city with the greatest potential, if it can effectively deal with the challenges
Depending on how we respond to the challenges, three scenarios could emerge…
FLY The dig-out port is developed with high number of local suppliers and Transnet uses this opportunity to invest and re-configure the old port to become more competitive. Logistics cost decrease. Supporting infrastructure is developed including rail and a dedicated road based route and supporting logistics hubs. The Municipality pro-actively unlocks land for industrial growth & undertakes Brownfield redevelopment in the SDB as well as successful SEZs – and growth occurs along the 2 priority corridors (west and north). The region experiences a period of industrial growth supported by growth in the services sector. The city adopts a pro-development/investment stance and monitors closely the cost of doing business. A regional approach is adopted where Durban ultimately becomes the service centre for the region. Business tourism grows as well as leisure, particularly in the cruise industry. The region becomes integrated and employment & GDP grows. Growth peaks above 7% and stabilizes at about 6%. STEP CHANGE IN ECONOMIC LEADERSHIP - AMBITOUS CITY VISION AND ACTION – A NEW GROWTH PATH REQUIRES PRIORITISATION FLOAT This scenario assumes that there is a delay in finalization of the port expansion. The land is sterilized and growth occurs incrementally in the north of the city only. The Municipality and its partners do not proactively seek to improve the availability of industrial land and growth is driven by construction in the north and the services sectors, while manufacturing experiences little or no growth. Growth in the western corridor is hampered and the city does not adopt a pro-active or regional approach to development. Growth is moderate and the Municipality’s finances are slowly degraded. Service delivery protests persist while some gains are made on an incremental basis. Political pressures increase. City grows at about 2.8%. BUSINESS AS USUAL CHOKE This scenario assumes that the dig-out port is developed, without adequate supporting infrastructure and relies heavily on road transport. The proposed dry-port is not developed and other potential supporting hubs that are prevalent to support most large ports around the world, are not developed as the focus is purely in driven by the SOE. EThekwini supports the development but does not produce its own plan on how to maximize on potentials, hence the port serves Gauteng mainly. A growth spurt is experienced during construction but decline in the long-term as the supporting infrastructure crumbles and the lifestyle and tourism appeal of EMA diminishes and the lifestyle focus shifts north towards ILembe. There is some growth on the borders of eThekwini due to proactive municipalities providing industrial premises, but there is an insular approach within the city. The old port becomes less competitive. The growth in the medium term leads stakeholders to believe that the city is doing well. This scenario is driven by a Transnet vision, but a lack of City vision. TRANSNET VISION-LACK OF CITY VISION ?
WHAT DO WE DO? Stay as we are Performance slowly slips OR Make a ‘step change’
GROWTH TRAJECTORY PER 5 YEAR PHASE • Unblocking key developments • Packaging of land in inner city • Implement industrial park projects • Township projects • Innovation centre and technology park developed • Trade centre under construction • Improved investment environment for large and small firms • DTP SEZ becomes operational and some growth around DTP • Large investments in bulk infrastructure • groundwork geared to unlocking N3 corridor in future phase • Nodal developments and IRPTN • Special focus on youth, social economy and micro LED • Transformation • SMME drive • Key locations along N3 unlocked and growth happens in Durban –Pmb Corridor • Further growth around DTP • Infrastructure to unlock growth • Phase 1 DIA Dig-out • Construction of freight route • unlocking land along freight route • Development of Logistics hubs begin • Industrial renewal work in SDB • SMME drive • Last industrial areas unlocked • Integration along Durban – Pmb and Durban – iLembe corridors • Promote Development along freight route • Commercial and residential densification • High growth in services sectors (Logistics services; professional services; finance; ICT; Tourism) • Regional integration/ City region • Green economy becomes major sector • purely competitiveness & innovation focus on manufacturing • Densification High investment in skills towards gearing of forthcoming phase High investment in infrastructure to unlock growth 2013-2018 2018-2023 2023-2028 2028-2033 Manufacturing sectors; innovation (and ICT); Logistics, Tourism Logistics; Manufacturing, Green Economy; Construction, Tourism Logistics; Manufacturing, ICT, Tourism, Green Economy Logistics, Tourism, Green Economy, ICT, Finance & Trade
Vision:Africa’s Southern Gateway to Trade and Travel • MISSION • To become the leading metropolitan region in achieving a sustainable and accelerated economic growth path which will be supported by a ‘step change in economic leadership’ in delivering catalytic growth initiatives and quality job creation efforts that positively assists Business, Provincial and National Government in addressing poverty, income inequality and unemployment • OUTCOMES: • Reduced unemployment • Reduced income and spatial inequality and poverty • Creating sustainable economic growth and development • Becoming a global metropolis over the next 20 years
Leverage Maximum Benefit from Infrastructure Spend Leverage Maximum Benefit from Infrastructure Spend Economic Leadership Leverage Maximum Benefit from Infrastructure Spend Leverage Maximum Benefit from Infrastructure Spend
ECONOMIC LEADERSHIP TO UNLOCK KEY DECISIONS ‘Step Change in Economic Leadership’ FACILITATE PRIVATE SECTOR INVESTMENT AND PARTNERSHIPS‘ Pro-investment City’
INVESTING IN KEY INFRASTRUCTURE ‘Growing the infrastructure platform’ LEVERAGE MAXIMUM LOCAL BENEFITS FROM INFRASTRUCTURE DEVELOPMENT‘Localisation’
PROMOTING INVESTMENT IN PRIORITY NODES AND CORRIDORS ‘Efficient form’ PRIORITISING TOWNSHIP DEVELOPMENT ‘Address the past unlock the future’
EXPANDING THE LABOUR MARKET ‘More jobs and better jobs’ DEVELOPING A COMPETITIVE TOURISM SECTOR ‘Work is Play’
ENTERPRISE DEVELOPMENT, TRADE AND SECTOR SUPPORT ‘Fostering Industry’
SUPPORTING SOCIAL ECONOMY INITIATIVES IN RURAL AND HISTORICALLY DISADVANTAGED REGIONS ‘Supporting the poor’ Prioritise areas of poverty for socio-economic interventions
CATALYTIC PROJECTS EXISTING NEW SUB-REGIONAL AND COMMUNITY LEVEL PROJECTS
INSTITUTIONAL AREAS FOR FOCUS • Business Advisory Forum • SMME Advisory • BPCC (Investment Advisory) • Key Client Forum
EDS IN RELATION TO CITY STRATEGY IDP Inform Priorities
Targets In order to meet the targets of the New Growth Path and National Development Plan, eThekwini must:- • Double existing jobs created in local economy (45 000) • Achieve an economic growth rate of between 4% to 7% per annum between 2013 to 2017 • In order to reduce inequality, the Gini Coefficient should be reduced 0.62 to 0.58 by 2017 Partnerships with Industry and Leadership by Council
Way Forward • NEED FOR LEADERSHIP TO CHAMPION ECONOMIC ISSUES (SENIOR MANAGMENT) • INTERNAL CONSULTATION (Stratman All 10/09) • EXTERNAL CONSULTATION (During Business Faire) • ECOD FOR APPROVAL IN NOVEMBER • DEVELOP A 5 YEAR ECONOMIC PLAN TO LINK TO IDP • REVIEW IMPLEMENTATION MECHANISMS TO IMPLEMENT THE STRATEGY INCLUDING SPVS • MONITORING AND EVALUATION DRAFT • Thank You • Unless there is a ‘Step Change’ in economic leadership which facilitates a change in the way the Municipality seeks to address the economic challenge of unemployment, poverty and inequality, we will fail to reach the destination that we collectively desire.