Download
1 / 11
110 likes | 203 Views
Understanding the grading system for Common Exams and End-of-Course (EOC) tests, including the curve methodology, delay in grades due to data collection, and implications for report cards. Explore how grades are calculated and distributed across different school levels.

E N D
End-of-Course and Common Exams:Grading Rationale and Delay Parent Advisory Council January 22, 2013
End-of-Course (EOC) • EOCs as grades • At December 2012 SBE meeting, the board approved a waiver for the 2012-13 school year of the EOC grade requirement • Became local decision; WS/FCS has an existing local regulation to count final exams as 25% of final grade (AR 5124) • Methodology for grades is now a local decision as well
Measures of Student Learning/Common Exams • How/if it counts as grades are determined by each school system • High School: just like a final exam - 25% of final grade • Middle School: just like how EOGs are currently counted – 20% of final grade in the respective subject • Elementary School: not assessing with Common Exams this year • Scores returned by software will reflect items answered correctly (no proficiency cut score) • We have created a district ‘curve’ that reflects a similar pattern to EOC grades
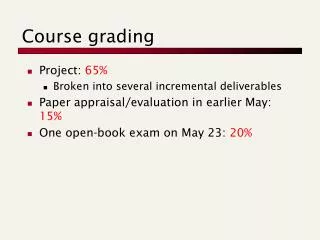
Curve Methodology Curve for EOCs and CEs: Top 17% of scores assigned an A Next 30% assigned a B 26% assigned a C 17% assigned a D 10% assigned an F
Concerns about Curve • Curve works best when data reflect a normal curve • Required subjects (EOCs) follow a normal curve • What if most/all students do well? • Some Common Exams – like Pre-Calculus • Solution: calculate the % of items correct for students and give the higher between curve and percentage
Example • A student answers 39 out of 50 items correctly, which is the lowest score in the test distribution • The curve would assign an F • The actual percentage correct is 39/50, or 78% (which is a C) • Student would receive the C • Can do this for Common Exams, but not EOCs
Third Option • Look at final mark percentages for actual courses (multiple years for stability) • EXAMPLE: PRE-CALCULUS (2004-12 – 13,206 records) • 24% As (17) • 33% Bs (30) • 27% Cs (26) • 13% Ds (17) • 3% Fs (10)
Delay in Grades • Will need 95% of all available data before curves can be calculated • Common Exams: contingent on constructed response scoring; • Test Window was January 10-11 • Majority of scoring should occur January 14-18 • Estimated to have grade rosters to schools by January 25
Delay in Grades • Will need 95% of all available data before curves can be calculated • EOCs: • Test Window is January 14-18 • Algebra 1 and Biology – should have grade rosters by January 24 • English 2 – is sent off to vendor (not scored in district); will take 5-7 business days once tests arrive at vendor • Rosters should be available the week of February 8
Report Cards • High school report cards will be distributed on February 1 • Later than normal date to accommodate brief delay in reporting Common Exams and some EOCs • We anticipate only English 2 to be initially recorded as incompletes