Download
1 / 34
340 likes | 649 Views
CAPITAL BUDGETING. Hendra 122121047 Gyda Chandra 122121043 Citra Yuliana Agustina 122121021. Introduction. Capital refers to longterm assets used in production Budget is a plan that outlines projected expenditures during a future period

E N D
CAPITAL BUDGETING Hendra 122121047 Gyda Chandra 122121043 Citra Yuliana Agustina 122121021
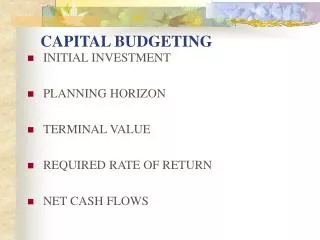
Introduction Capital refers to longterm assets used in production Budget is a plan that outlines projected expenditures during a future period Capital budget is a summary of planned investments of assets that will last for more than a year
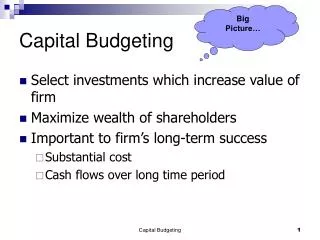
What is capital budgeting? Capital budgeting is the whole process of analyzing projects and deciding which ones to accept and thus include in the capital budget Analysis of potential projects. Long-term decisions; involve large expenditures. Very important to firm’s future.
CAPITAL BUDGETING Why? Business Application Valuing projects that affect firm’s strategic direction Methods of valuation used in business Parallels to valuing financial assets (securities) • Perhaps most impt. function financial managers must perform • Results of Cap Budgeting decisions continue for many future years, so firm loses some flexibility • Cap Budgeting decisions define firm’s strategic direction. • Timing key since Cap Assets must be put in place when needed
Capital Budgeting Project Categories Replacement to continue profitable operations Replacement to reduce costs Expansion of existing products or markets Expansion into new products/markets Contraction decisions Safety and/or environmental projects Mergers Other
Independent versusMutually Exclusive Projects Projects are: independent, if the cash flows of one are unaffected by the acceptance of the other. mutually exclusive, if the cash flows of one can be adversely impacted by the acceptance of the other.
Normal vs. Nonnormal Cash Flows Normal Cash Flow Project: Cost (negative CF) followed by a series of positive cash inflows. One change of signs. Nonnormal Cash Flow Project: Two or more changes of signs. Most common: Cost (negative CF), then string of positive CFs, then cost to close project.
Net Present Value (NPV) NPV defined as the present value of a project’s cash inflows minus the present value of its costs, tells us how much the project contributes to shareholder wealth—the larger the NPV, the more value the project adds and thus the higher the stock’s price. The equation for the NPV :
NPV Decision Rules Independent projects: If NPV exceeds zero, accept the project. Since S and L both have positive NPVs, accept them both if they are independent. Mutually exclusive projects: Accept the project with the highest positive NPV. If no project has a positive NPV, then reject them all. If S and L are mutually exclusive, the NPV criterion would select L. Projects must be either independent or mutually exclusive, so one or the other of these rules applies to every project.
Internal Rate of Return: IRR 0 1 2 3 CF0 CF1 CF2 CF3 Cost Inflows IRR is the discount rate that forces PV inflows = PV costs. Same as that creates NPV= 0. ::i.e., project’s breakeven interest rate.
NPV: Enter r, Solve for NPV N CFt Σ = NPV (1 + r)t t = 0 N CFt Σ = 0 (1 + IRR)t t = 0 IRR: Enter NPV = 0, Solve for IRR IRR is an estimate of the project’s rate of return, so it is comparable to the YTM on a bond. 13
The Multiple IRR ProblemA multiple IRR problem occurs when cash flows during the project lifetime are negative (i.e. the project operates at a loss or the company needs to contribute more capital).
Example A company invests $10,000 in a computer and results in equivalent annual labor savings of $4,021 over 3 years. The company is said to earn a return of 10% on its investment of $10,000.
Project Balance Calculation: 0 1 2 3 Beginning project balance Return on invested capital Payment received Ending project balance -$10,000 -$6,979 -$3,656 -$1,000 -$697 -$365 -$10,000 +$4,021 +$4,021 +$4,021 -$10,000 -$6,979 -$3,656 0 The firm earns a 10% rate of return on funds that remain internally invested in the project. Since the return is internal to the project, we call it internal rate of return.
800=5000/(1+n)-5000/(1+n)2 Let (1+n) = x 800=5000/x-5000/x2 800x2 = 5000x-5000 800x2 - 5000x + 5000 =0 800x2 - 4000x - 1000x + 5000 =0 800x(x-5)-1000(x-5)=0 (800x-1000x)(x-5)=0 x = 1.25 and 5 1 + n = 1.25 -> n = 1.25-1=0.25 ~ 25% 1 + n = 5 -> n = 5-1=4 ~ 400% Rate of return = 25 and 400 % n=10% -800 5000 -5000
Multiple Rate of Return Why has this happened ? Due to non – conventional cash flows What to do? The solution is to calculated Modified Internal Rate of Return (MIRR)
MIRR : Step 1. Calculate PV of outflows at 10% (-800X1)-5000/(1+0.1)2= - 4932.23 Step 2. Calculate of FV of Inflows at 10% 5000(1.10) = 5500 Step 3. Equate of PV of outflows with the PV of FV of Inflows and solve for ‘n’ 4932.23=5500/(1+n)2 4932.22(1+n)2=5500 (1+n)2 = 5500/4932.23 1+n=[5500/4932.23]1/2 n = [5500 / 4932.23]1/2 – 1 = 0.0559 = 5.59 % Rate of return = 5.59 % n=10% -800 5000 -5000
Net Present Value Profiles • Ada 2 kondisi dasar yang menyebabkan NPV profiles menyebabkan konflik: a. Perbedaan waktu Terjadi saat sebagian besar arus kas satu proyek datang di awal, sementara sebagian besar datang dari proyek lain kemudian. b . Perbedaan ukuran proyek / skala Terjadi jika jumlah yang diinvestasikan dalam satu proyek lebih besar daripada proyek yang lain. • Rumus = CF0 + CF1 + CF2 + … + CFN (1+r)1 (1+r)2 (1+r)N
Contoh soal NPV Diketahui = CFo 1 = 5% CF1 = 10% PV = $ 100 Ditanya NPV tahun 1 cash flow: NPV = 5% : $100 = $ 95,24 (1.05)1 10% : $100 = $ 90,91 (1.10)1 Presentase penurunan r = $95,24 - $90,91 = 4,5%
PROFITABILITY INDEX • Sering disebut juga dengan cost of benefit ratio. • Kriteria seleksi: Memilih beberapa usulan yang menghasilkan nilai PI > 1 dan merupakan nilai yang tertinggi • Rumus = PV of future cash flows Initial cost
Contoh Soal PI: Perusahaan X dihadapkan pada 2 pilihan untuk mengimplementasikan sistem material handling pada perusahaan mereka yaitu sbb: • Proyek A total biaya investasinya Rp 1.000.000. Proceeds selama 10 thn Rp 200.000/thn. • Proyek B total biaya investasinya Rp 300.000. Proceeds selama 10 thn Rp 51.560/thn. Dengan Cost of capital sebesar 12 %,proyek mana yang akan dipilih?
Jawab: • PI a = PVIFA(12%,10) x Rp 200.000 Rp 1.000.000 = 5,6502 x Rp 200.000 Rp 1.000.000 = 1,13 • PI b = PVIFA(12%, 10) x Rp 51.560 Rp 300.000 = 0,9711 Kesimpulan: Proyek yang dipilih adalah proyek A karena menghasilkan nilai PI > 1.
PAYBACK PERIOD • Payback period merupakan metode untuk menentukan berapa lama suatu investasi akan kembali. • Waktu yang diharapkan adalah waktu terendah dari pengembalian nilai investasi kita. • Rumus = Uncover cost at Number of years + start of the year prior to recovery Cash flow during full recovery year
Contoh soal 1 Payback Period: Total investasi proyek A Rp 200 juta. Penerimaan investasi per tahun Rp 40 juta. Payback period nya adalah 5 tahun (Rp 40 jt x 5 tahun). • Contoh soal 2 Payback Period: Total investasi Rp 100 juta Proceeds tahun 1 = Rp 30 juta Proceeds tahun 2 = Rp 40 juta Proceeds tahun 3 = Rp 30 juta Proceeds tahun 4 = Rp 40 juta Proceeds tahun 5 = Rp 30 juta Hitung Payback period nya:
Jawab: Total investasi Rp 100 jt Proceed thn 1 Rp 30 jt Dana yg blm kembali Rp 70 jt Proceed thn 2 Rp 40 jt Dana yg blm kembali Rp 30 jt Proceed thn 3 Rp 30 jt Dana yg blm kembali Rp 0 Jadi payback period untuk proyek tersebut adalah 3 tahun.
DISCOUNTED PAYBACK PERIOD • Discounted payback period merupakan metode untuk menentukan berapa lama suatu investasi akan kembali dengan mendiskonkan cash inflow sebesar cost of capital (COC). • Waktu yang diharapkan adalah waktu terendah dari pengembalian nilai investasi kita.
Contoh Discounted Payback Period: Total investasi Rp 100 juta Proceeds tahun 1 = Rp 30 juta Proceeds tahun 2 = Rp 40 juta Proceeds tahun 3 = Rp 30 juta Proceeds tahun 4 = Rp 40 juta Proceeds tahun 5 = Rp 30 juta Diketahui COC = 10% Hitung Discounted payback period nya:
Jawab: 0 1 2 3 4 5 NET cash flow -100 30 40 30 40 50 Discounted NCF -100 27,3 33,1 22,5 27,3 48,6 Total investasi Rp 100 jt Proceed thn 1 Rp 27,3 jt Dana yg blm kembali Rp 72,7 jt Proceed thn 2 Rp 33,1 jt Dana yg blm kembali Rp 39,6 jt Proceed thn 3 Rp 22,5 jt Dana yg blm kembali Rp 17,1 jt Jadi discounted payback period untuk proyek tersebut adalah : = 3 tahun + 17,1 jt 27,3 jt = 3,6 tahun
Conclusion Capital Budgeting Evaluation Methods : • Net Present Value (NPV) • Internal Rate of Return (IRR) • Modified Internal Rate of Return (MIRR) • Profitability Index (PI) • Payback Periode & Discounted Payback Periode