Download

1 / 23
230 likes | 343 Views
This chapter delves into the intricate functioning of the price system in allocating resources through price rationing. It addresses how excess demand can compel market adjustments and examines alternative rationing mechanisms like queuing and ration coupons. The impact of price floors and ceilings, illustrated through historical examples like gasoline prices and art auctions, is analyzed to highlight the complex interplay of supply, demand, and overall market efficiency. The chapter emphasizes that attempts to bypass price mechanisms often lead to unintended consequences affecting households and market fairness.

E N D
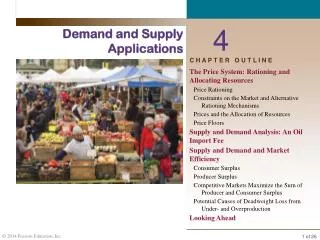
4 Demand and Supply Applications CHAPTER OUTLINE The Price System: Rationing and Allocating Resources Price Rationing Constraints on the Market and Alternative Rationing Mechanisms Prices and the Allocation of Resources Price Floors Supply and Demand Analysis: An Oil Import Fee Supply and Demand and Market Efficiency Consumer Surplus Producer Surplus Competitive Markets Maximize the Sum of Producer and Consumer Surplus Potential Causes of Deadweight Loss from Under- and Overproduction Looking Ahead
The Price System: Rationing and Allocating Resources price rationing The process by which the market system allocates goods and services to consumers when quantity demanded exceeds quantity supplied.
The Price System: Rationing and Allocating Resources Price Rationing FIGURE 4.1The Market for Wheat Fires in Russia in the summer of 2010 caused a shift in the world‘s supply of wheat to the left, causing the price to increase from $160 per millions of metric tons to $247. The equilibrium moved from C to B.
The Price System: Rationing and Allocating Resources Price Rationing FIGURE 4.2Market for a Rare Painting There is some price that will clear any market, even if supply is strictly limited. In an auction for a unique painting, the price (bid) will rise to eliminate excess demand until there is only one bidder willing to purchase the single available painting. Some estimate that the Mona Lisa would sell for $600 million if auctioned.
The Price System: Rationing and Allocating Resources Constraints on the Market and Alternative Rationing Mechanisms On occasion, both governments and private firms decide to use some mechanism other than the market system to ration an item for which there is excess demand at the current price. • Regardless of the rationale, two things are clear: • Attempts to bypass price rationing in the market and to use alternative rationing devices are more difficult and more costly than they would seem at first glance. • 2. Very often such attempts distribute costs and benefits among households in unintended ways.
The Price System: Rationing and Allocating Resources Constraints on the Market and Alternative Rationing Mechanisms Oil, Gasoline, and OPEC price ceiling A maximum price that sellers may charge for a good, usually set by government. FIGURE 4.3Excess Demand (Shortage) Created by a Price Ceiling In 1974, a ceiling price of $0.57 cents per gallon of leaded regular gasoline was imposed. If the price had been set by the interaction of supply and demand instead, it would have increased to approximately $1.50 per gallon. At $0.57 per gallon, the quantity demanded exceeded the quantity supplied. Because the price system was not allowed to function, an alternative rationing system had to be found to distribute the available supply of gasoline.
The Price System: Rationing and Allocating Resources Constraints on the Market and Alternative Rationing Mechanisms queuing Waiting in line as a means of distributing goods and services: a nonprice rationing mechanism. favored customers Those who receive special treatment from dealers during situations of excess demand. ration coupons Tickets or coupons that entitle individuals to purchase a certain amount of a given product per month. black market A market in which illegal trading takes place at market-determined prices.
The Price System: Rationing and Allocating Resources Constraints on the Market and Alternative Rationing Mechanisms Rationing Mechanisms for Concert and Sports Tickets FIGURE 4.4Supply of and Demand for a Concert at the Staples Center At the face-value price of $50, there is excess demand for seats to the concert. At $50 the quantity demanded is greater than the quantity supplied, which is fixed at 20,000 seats. The diagram shows that the quantity demanded would equal the quantity supplied at a price of $300 per ticket.
The Price System: Rationing and Allocating Resources Constraints on the Market and Alternative Rationing Mechanisms No matter how good the intentions of private organizations and governments, it is very difficult to prevent the price system from operating and to stop willingness to pay from asserting itself. Every time an alternative is tried, the price system seems to sneak in the back door. With favored customers and black markets, the final distribution may be even more unfair than what would result from simple price rationing.
The Price System: Rationing and Allocating Resources Prices and the Allocation of Resources Price changes resulting from shifts of demand in output markets cause profits to rise or fall. Profits attract capital; losses lead to disinvestment. Higher wages attract labor and encourage workers to acquire skills. At the core of the system, supply, demand, and prices in input and output markets determine the allocation of resources and the ultimate combinations of goods and services produced.
The Price System: Rationing and Allocating Resources Price Floor price floor A minimum price below which exchange is not permitted. minimum wage A price floor set for the price of labor.
E C O N O M I C S I N P R A C T I C E The Price Mechanism at Work for Shakespeare Every summer, New York City puts on free performances of Shakespeare in the Park. The true cost of a ticket is $0 plus the opportunity cost of the time spent in line. Students can produce tickets relatively cheaply by waiting in line. They can then turn around and sell those tickets to the high-wage Shakespeare lovers.
Supply and Demand Analysis: An Oil Import Fee FIGURE 4.5The U.S. Market for Crude Oil, 1989 At a world price of $18, domestic production is 7.7 million barrels per day and the total quantity of oil demanded in the United States is 13.6 million barrels per day. The difference is total imports (5.9 million barrels per day). If the government levies a 33 1/3 percent tax on imports, the price of a barrel of oil rises to $24. The quantity demanded falls to 12.2 million barrels per day. At the same time, the quantity supplied by domestic producers increases to 9.0 million barrels per day and the quantity imported falls to 3.2 million barrels per day.
Supply and Demand and Market Efficiency Consumer Surplus consumer surplus The difference between the maximum amount a person is willing to pay for a good and its current market price.
Supply and Demand and Market Efficiency Consumer Surplus FIGURE 4.6Market Demand and Consumer Surplus As illustrated in (a), some consumers (see point A) are willing to pay as much as $5.00 each for hamburgers. Since the market price is just $2.50, they receive a consumer surplus of $2.50 for each hamburger that they consume. Others (see point B) are willing to pay something less than $5.00 and receive a slightly smaller surplus. Since the market price of hamburgers is just $2.50, the area of the shaded triangle in (b) is equal to total consumer surplus.
Supply and Demand and Market Efficiency Producer Surplus producer surplus The difference between the current market price and the full cost of production for the firm.
Supply and Demand and Market Efficiency Producer Surplus FIGURE 4.7Market Supply and Producer Surplus As illustrated in (a), some producers are willing to produce hamburgers for a price of $0.75 each. Since they are paid $2.50, they earn a producer surplus equal to $1.75. Other producers are willing to supply hamburgers at a price of $1.00; they receive a producer surplus equal to $1.50. Since the market price of hamburgers is $2.50, the area of the shaded triangle in (b) is equal to total producer surplus.
Supply and Demand and Market Efficiency Competitive Markets Maximize the Sum of Producer and Consumer Surplus FIGURE 4.8Total Producer and Consumer Surplus Total producer and consumer surplus is greatest where supply and demand curves intersect at equilibrium.
Supply and Demand and Market Efficiency Competitive Markets Maximize the Sum of Producer and Consumer Surplus deadweight loss The net loss of producer and consumer surplus from underproduction or overproduction.
Supply and Demand and Market Efficiency FIGURE 4.9Deadweight Loss Figure 4.9(a) shows the consequences of producing 4 million hamburgers per month instead of 7 million hamburgers per month. Total producer and consumer surplus is reduced by the area of triangle ABC shaded in yellow. This is called the deadweight loss from underproduction. Figure 4.9(b) shows the consequences of producing 10 million hamburgers per month instead of 7 million hamburgers per month. As production increases from 7 million to 10 million hamburgers, the full cost of production rises above consumers’ willingness to pay, resulting in a deadweight loss equal to the area of triangle ABC.
Supply and Demand and Market Efficiency Potential Causes of Deadweight Loss from Under- and Overproduction When supply and demand interact freely, competitive markets produce what people want at least cost, that is, they are efficient. There are a number of naturally occurring sources of market failure. Monopoly power gives firms the incentive to underproduce and overprice, taxes and subsidies may distort consumer choices, external costs such as pollution and congestion may lead to over- or underproduction of some goods, and artificial price floors and price ceilings may have the same effects.
R E V I E W T E R M S A N D C O N C E P T S black market consumer surplus deadweight loss favored customers minimum wage price ceiling price floor price rationing producer surplus queuing ration coupons