Download
1 / 10
100 likes | 236 Views
MAPPING POVERTY AND HOUSING NEED IN LONG BEACH Maidel Luevano , UP206a, Winter 2011. BACKGROUND. According to the Housing Authority of the City of Long Beach website: they currently partner with 2,500 property owners provide 6,300 households with housing assistance and related services

E N D
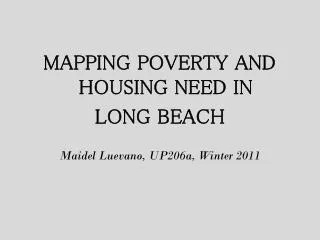
MAPPING POVERTY AND HOUSING NEED IN LONG BEACH MaidelLuevano, UP206a, Winter 2011
BACKGROUND • According to the Housing Authority of the City of Long Beach website: • they currently partner with 2,500 property owners • provide 6,300 households with housing assistance and related services • However, based on anecdotal information, the waitlists for affordable housing and Section 8 programs are long. Some people report waiting upwards of 3-5 years; some as long as 10. • Thus the point of departure for this project’s analysis will be to explore the questions of affordable housing supply and it’s spatial relationship to income and poverty indicators; i.e. where is the affordable housing need in Long Beach? Map created by MaidelLuevano Sources: Housing Authority of the City of Long Beach (HACLB)
PROJECT STUDY AREA: LONG BEACH, CA Map created by MaidelLuevano Sources: U.S. Census Bureau, ESRI
DEMOGRAPHICS Map created by MaidelLuevano Sources: U.S. Census Bureau
INCOME DISTRIBUTION IN LONG BEACH Map created by MaidelLuevano Sources: U.S. Census Bureau, ESRI
AFFORDABLE HOUSING UNITS IN LONG BEACH Map created by MaidelLuevano Sources: U.S. Census Bureau, ESRI, HACLB
RENT BURDEN IN LONG BEACH Map created by MaidelLuevano Sources: U.S. Census Bureau, ESRI
AFFORDABLE HOUSING BUFFER ZONES IN LONG BEACH Map created by MaidelLuevano Sources: U.S. Census Bureau, ESRI
NEXT STEPS • Extract data from the affordable housing buffer zones to analyze the relationships between income distribution patterns, poverty concentration trends and access to affordable housing. • Come up with variables to gage issues of equity in access to community resources such as: workforce development programs, youth centers, mobility factors and affordable housing programs • Possible policy questions: • Why is the wait for affordable housing so long in Long Beach? • Where are the best places to build more affordable housing in Long Beach? • How can a spatial analysis of affordable housing units better inform the process of where to locate them?
SKILLS USED SLIDE NUMBER 3 7 5 8 3, 5, 6, 7, 8 6 4 Inset map Point or line graduated symbol Boundary sub-sets selections Buffering Geoprocessing Geocoding Charts, Graphs, or Images