Download
1 / 12
130 likes | 239 Views
SAL Structural Accessibility Layer. WU_PT1 Cecília Silva Vitor Oliveira, Ana Amante, Sílvia Sousa. Concepts. SAL: Geographical representation of comparative accessibility levels by types of transport to different types of opportunities Structural Accessibility:

E N D
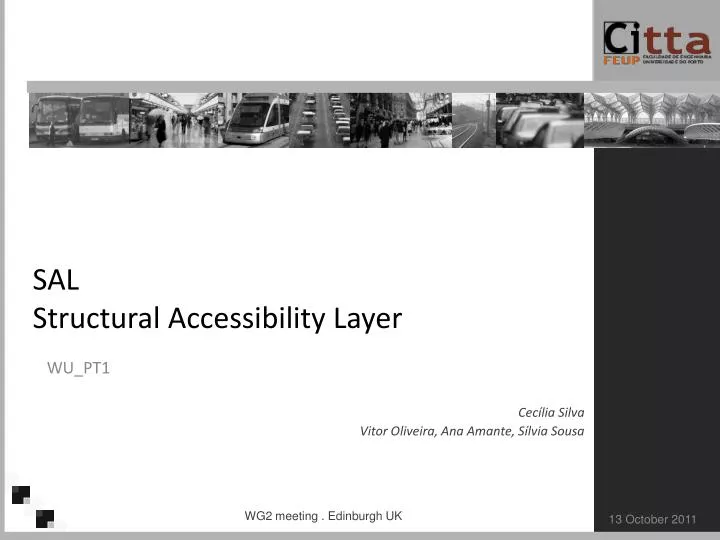
SALStructuralAccessibilityLayer WU_PT1 Cecília Silva Vitor Oliveira, Ana Amante, Sílvia Sousa WG2 meeting . Edinburgh UK
Concepts • SAL: • Geographical representation of comparative accessibility levels by types of transport to different types of opportunities • Structural Accessibility: • Assess how urban structure constrains travel choices Access to: different Activities People Access by: different Transport Modes WG2 meeting . Edinburgh UK
Method • Diversity of activities accessible • Ex: schools, hospitals, shops, services, parks • By transport mode: • Non-motorized, public transport and car • Comparison between accessibility levels by different transport modes WG2 meeting . Edinburgh UK
Indicators • Diversity of Activity Index: • Contour measure type 0 Noneoftheactivitiesisaccessible Accessibility to alltheconsideredactivities fy – ponderation factor regarding frequency of use 1 WG2 meeting . Edinburgh UK
Indicators • Accessibility Clusters (comparative measure): • High accessibility levels by particular transport modes • Favourable conditions for the use of those transport modes NM PT II I V III IV VI VII CAR WG2 meeting . Edinburgh UK
Input • Data: • Statistical data (at census track) • Population • Employment • Activities by type • Geographical data • Transport infrastructure • Mobility system service level WG2 meeting . Edinburgh UK
Input • Case specific • Study area boundaries • Level of spatial disaggregation • Relevant travel generating activities • Use frequency of activities (relative importance in travel) • Cut-off criteria and values (accessibility limits), such as: • Time • Cost • Convenience, etc • Meaning of high accessibility • Decision vs Survey WG2 meeting . Edinburgh UK
Output • Accessibility levels (from 0-1) of each census track by transport mode • Comparative accessibility: • land use and transport conditions enabling or disabling the use of particular modes • How urban structure constraints mode choice WG2 meeting . Edinburgh UK
Output Examples WG2 meeting . Edinburgh UK
Output examples WG2 meeting . Edinburgh UK
Usefulness in practice • Interviews with experts • Robustness • NMDivAct • Clusters • Usefulness as design support tool • Practical applicability • Legend: positive opinion uncertain negative opinion no answer Experts interviewed: 17 (transport, land use, practitioners, researchers) WG2 meeting . Edinburgh UK
SALStructuralAccessibilityLayer WU_PT1 Cecília Silva Vitor Oliveira, Ana Amante, Sílvia Sousa Thank you WG2 meeting . Edinburgh UK