Download
1 / 7
70 likes | 188 Views
This program conducts a comprehensive statistical analysis using the normal distribution. It loads a statistical package, defines probability density function (pdf) and cumulative distribution function (cdf) for a variable W, and utilizes clinical data to determine key parameters. It also calculates the initial endpoints for integration, plots the distribution, and determines normalization constants and p-values. Additionally, it computes quantiles, showcasing the 95th percentile, crucial for hypothesis testing in clinical research scenarios.

E N D
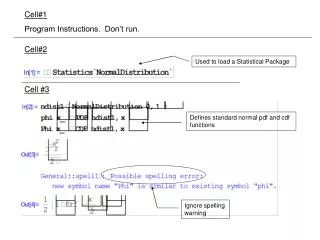
Cell#1 Program Instructions. Don’t run. Cell#2 Used to load a Statistical Package Cell #3 Defines standard normal pdf and cdf functions Ignore spelling warning
Cell #4 Clears existing values of variables that may have been used in other programs. Then defines a function that is proportional to the pdf of W.
Cell #5 Defines actual values from relevant clinical data and parameters of interest. σ is defined by s, and ∆ defined by Delta.
Cell #6 Defines the initial values for the endpoints of the integral, a & b.
Cell #7 Creates a plot of the distribution of W on [a, b]. If the plot indicates that the interval is not wide enough, values of a & b need to be manually set (trial and error) so that most of the distribution is captured before proceeding with additional Cells.
Cell#8 Finds the normalization constant, (1/cN), and defines the pdf of W, p[ W ]. Cell#9 Finds the various p-values that are typically of interest to researchers.
Cell#10 Defines the cdf of W, P[W]. The warnings can be ignored in version 4. Cell#11 This cell finds the qth quantile of the distribution, i.e. finds W such that P[W] = q. In the example below, the 95th percentile of the distribution is found to be 2.12. This typically would be the 5% critical value for a one-sided alternative hypothesis, e.g. HA: ∆ > 0.