Download
1 / 18
190 likes | 381 Views
Hydrologic losses from tropical forest soils– patterns and implications. Lars O. Hedin, Megan McGroddy, Ben Houlton, Emilio Moran and Mateus Battisella LC-09. Justification. Carbon cycling is constrained by availability of biologically essential nutrients. Goal.

E N D
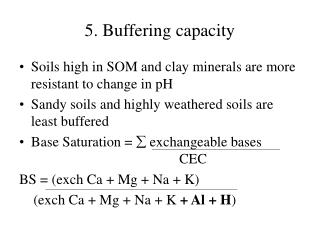
Hydrologic losses from tropical forest soils– patterns and implications Lars O. Hedin, Megan McGroddy, Ben Houlton, Emilio Moran and Mateus Battisella LC-09
Justification Carbon cycling is constrained by availability of biologically essential nutrients Goal To determine the biological and physical (climate and geological) controls over patterns of nutrient losses from lowland Amazonian forest ecosystems
foliar NP litter NP 180 160 140 120 N:P ratio 100 80 60 40 20 0 0 10 20 30 40 50 60 70 Latitude
4000 3000 - NO 3 2000 - NH 4 1400 DON 1200 1000 800 600 400 200 0 Other Tropical Hawaii S Temperate North America
Approach Extensive sampling Mature or undisturbed forests to determine “baseline” conditions
deposition denitrification occlusion ground water inputs
Research Approach 1st phase Determine impact of seasonality on nutrient concentrations and ratios 2nd phase Extend sampling to include a wider range of sites
1st phase sites Soils Leaf litter Altamira data from Moran et al. 2000 , Lu et al. 2002 Santarem data from Silver et al. 2000, Williams et al. 2002, Silver pers. comm. Manaus data from Luizão 1989, Luizão et al 2004
Santarem dry 10.0 Altamira dry Manaus wet 1.0 Altamira wet Santarem wet Mg ( ppm) 0.1 10.0 0.01 AltamiraSantaremManaus 1.0 Ca (ppm) 0.1 0.01 AltamiraSantaremManaus Results Manaus dry
10.0 1.0 Ca ppm 0.1 Seasalt Cl:Ca ratio 0.01 0 2 4 6 8 10 12 Cl ppm
10.00 1.00 NO3- N ppm 0.10 0.01 0.001 0.0001 AltamiraSantaremManaus
10 1 Total P ( ppb) 0.1 AltamiraSantarem Manaus
1000 100 TN:TP ratio 10 1 AltamiraSantarem Manaus
0.8 0.7 0.6 0.5 N concentration (ppm) 0.4 0.3 0.2 Organic N Inorganic N 0.1 0.0 Altamira SantaremManaus
4000 3000 - NO 3 2000 - NH 4 1400 DON 1200 1000 Brasil 800 600 400 200 0 Hawaii S Temperate Other Tropical Hawaii Mainland North America wells and lysimeters
Inputs 10 8 6 4 N of TDN (per mil vs. air) 2 0 -2 N Fixation 15 d -4 Streams Maui Forest Rainfall Gradient
Further goals Expand the sampling gradient in Brasil both in terms of geographic expanse and variability of state factors of interest Incorporate measures of biotic productivity and nutrient demand into analyses Include 15N and 18O analyses to determine the importance of denitrification pathways in these sites
Many thanks to: Chico Aves, Jo Bahiano, Niro Higuchi, Flavio Luizao, and the LBA Support Staff in Santarém and Manaus