Download
1 / 59
610 likes | 886 Views
Modeling of paleo-monsoon Akio KITOH Meteorological Research Institute, Japan Meteorological Agency. 1: Use of paleo-climate modeling 2: 6ka (Mid-Holocene) 3: 21ka (Last Glacial Maximum). Orogeny, plate motion and land-sea distribution

E N D
Modeling of paleo-monsoon Akio KITOH Meteorological Research Institute, Japan Meteorological Agency 1: Use of paleo-climate modeling 2: 6ka (Mid-Holocene) 3: 21ka (Last Glacial Maximum)
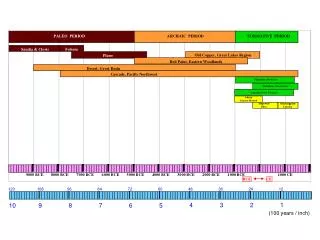
Orogeny, plate motion and land-sea distribution Uplift of the Himalayan/ Tibetan plateau and the retreat of the Paratethys played important role in driving the Asian monsoon changes Ramstein et al. (1997) Nature
4 types of large-scale forcing or b.c. for the South Asian monsoon the monsoon is most sensitive to the elevation and radiation (orbital) changes CCM1+50m mixed-layer Kutzbach et al. (1993) J.Geology
Use of paleo climate modeling Snapshot simulations of past climates by climate models can be very useful to investigate the physical mechanisms of climate change. They can be used for example to test the sensitivity of the climate system to supposed forcing of past climates such as variations in solar radiation, ice sheet extent or CO2.
Use of paleo climate modeling (cont) Past climate simulations also allow us to test the simulated climate sensitivity. AGCM parameterizations are developed and validated by using present-day observations. However, current data cannot ensure that these parameterizations will produce a correct sensitivity of the climate. Past climates offer a unique opportunity to test model results in this respect, at least when sufficiently quantitative and globally distributed paleo-data are available and when the causes of the changes are deterministic and well quantified.
Dome Concordia (Antarctica): 740,000 years of climate change (EPICA Members, 2004)
Mid-Holocene: 6ka Tassili n’Ajjer, Algeria - Sahara was greener
Paleoclimate Modeling Intercomparison Project (PMIP) PAGES/IGBP and WGNE/WCRP/CLIVAR • Mechanisms of climate change • sensitivity to model parameterizations • Evaluation of climat models Model-model and model-Data comparisons PMIP1 (1992-2000): AGCM AGCM-slab • Last Glacial Maximum, 21,000 yrs BP • Mid-Holocene, 6000 yrs BP • Early Holocene • Last glacial inception • Water hosing (CMIP/PMIP) PMIP2 (2003-????): OAGCM and OAVGCM http://www-lsce.cea.fr/pmip2
PMIP data: tropical water balance at LGM plant-available moisture runoff (equivalent to precipitation minus evaporation)
PMIP data: diagnostic for mid-holocene precipitation over Northern Africa
Experiment Control run 6ka–run (mid-Holocene) orbital parameters of 6,000 years ago same CO2concentration as in the control run 21ka–run (Last Glacial Maximum) orbital parameters of 21,000 years ago CO2concentration 200 ppm ice sheet (Peltier 1994) control 6ka 21ka eccentricity 0.016724 0.018682 0.018944 obliquity 23.446 24.105 22.949 precession 102.04 0.87 114.42
6,000 yr BP monsoon mid-Holocene
Insolation at present and 6,000 years ago In the NH, insolation was larger in summer and less in winter. Annual mean insolation anomaly was positive in high latitudes, and was negative, about –1 W/m2, in the tropics.
TOA insolation difference at 6ka and 21ka Note the different scale. The 6ka has a larger seasonal variation with negative anomaly in NH winter and positive in NH summer. In the tropics, annual mean difference is -1 W/m2 in 6ka and +1 W/m2 in 21ka.
Mid-Holocene climate # The Afro-Asian summer monsoon was stronger and shifted northward # Weaker and less frequent ENSO activity # SSTs in the western Pacific were about 1oC warmer and rainfall was less variable - more La Nina like state in the mean
MRI 6ka JJA Surface Temp, Precip, Wind Afro-Asian monsoon shifts northward. Negative ground temp. Easterly wind anom in the Western Pacific (stronger Walker). La Nina type.
MRI 6ka DJF Surface Temp, Precip, Wind Strong Asian winter monsoon. Annual mean SST 0.35C decrease.
PMIP Following the insolation change, all PMIP models simulate an increased seasonal cycle of temperature over the continents of the northern hemisphere, reaching about +/-1C on global average for the winter/summer seasons.
PMIP The summer warming reaches a maximum between 40N and 50N with more than 2C, whereas the cooling occurs further south, between 0N and 30N, with a similar magnitude.
N Africa Precip • Models do not reproduce precipitation to maintain steppe climate • Importance of air-sea interaction and vegetation feedback
Jan-Feb-Mar Temperature difference (6ka–0ka) with 4 CGCMs Zhao et al. 2004
Jul-Aug-Sep Temperature difference (6ka–0ka) with 4 CGCMs Zhao et al. 2004
Jul-Aug-Sep Precipitation difference (6ka–0ka) with 4 CGCMs Zhao et al. 2004
Jul-Aug-Sep 850hPa wind difference (6ka–0ka) with 4 CGCMs Zhao et al. 2004
6ka precipitation anomalies over northern Africa (20W-30E) by AGCM and CGCM Maximum precip: 10-15N in AGCM 10-18N in CGCM
21,000 yr BP monsoon Last Glacial Maximum
PMIP An annual mean global cooling of about 4C is obtained by all the models forced by the CLIMAP SST estimates. The range of cooling is larger when using computed SSTs, from –6C to –2C, since models are no longer constrained by the same change in SST.
PMIP Compared to the fixed SST experiments, computed SST experiments produce a greater inter-hemispheric difference with a weaker cooling in the southern hemisphere due to less sea ice extent than prescribed by CLIMAP. In the tropics, computed SSTs are colder than CLIMAP, especially over the tropical Pacific where the warm pools of CLIMAP are not reproduced.
PMIP According to both sets of PMIP simulations, the LGM climate is also more arid over most of the northern continents and in the tropics. At the regional scale, the simulations are characterized by a number of common features, including a reduction in the strength of the Afro-Asian monsoon and increased intertropical aridity.
MRI 21ka annual mean SST: CLIMAP vs GCM Large decrease in high latitudes. East-west contrast in the tropics, larger decrease in the Caribbean. Positive SST anomaly in the subtropical Pacific.
MRI LGM Precip: Observed proxy vs GCM top pollen data middle lake level data bottom GCM (P - E) Farrera et al. 1999 Clim Dyn
・ How does the climate model project as a future climate? ・ Can we use the past warm-day climate as a proxy of the future climate?
MRI JJA Precipitation & 850hPa Winds Northward shift of monsoon westerly and intensified rainfall over the Afro-Asian summer monsoon region. Easterly anomaly over the western tropical Pacific associated with strengthened subtropical anticyclones.
MRI JJA Precipitation: CO2 vs 6ka Overall resemblance. In the 6ka run, a northward shift of the Afro-Asian monsoon rainfall belt is more pronounced with a decrease over the ocean south of India.
MRI JJA 850hPa Winds: CO2 vs 6ka Also similar each other. There is a northward shift of monsoon westerly around India, easterly anomaly in the western Pacific, westerly anomaly around Japan, and westerly anomaly in the equatorial eastern Pacific.
MRI JJA Surface Temperature: CO2 vs 6ka The CO2 run shows an overall increase with its maximum in the 40 deg latitude. There is a mimimum over the monsoon rain belt due to increased rainfall. In the 6ka run, temperature increases in the northern continent. The monsoon rain belt corresponds to negative temperature anomaly. SST lower about 0.4 deg C.