Download
1 / 2
20 likes | 97 Views
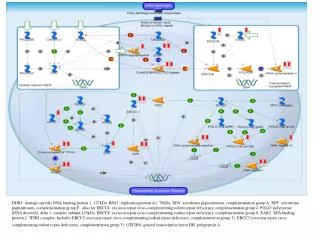
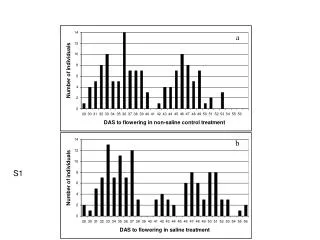
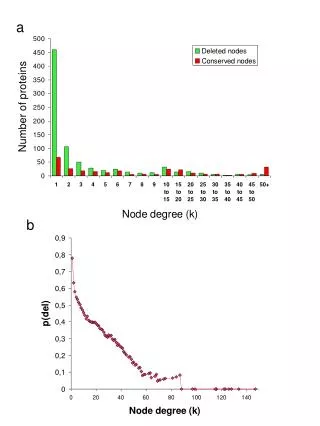
This figure illustrates the relationship between protein connectivity and deletion in both the E. coli and Buchnera networks. The graph displays the number of proteins in the E. coli network based on their connections and their conservation or deletion in the Buchnera network. Nodes with fewer connections are more likely to be deleted. Additionally, it examines the probability of node deletion (pdel) relative to the probable number of connections (k).

E N D
a b
Figure S1: a) Connectivity versus deletion. The figure shows the number of proteins in the E.coli network with a given number of connections (partners), and their conservation or deletion in the Buchnera network. Deleted nodes are mainly those with few connections. b) Probability of the deletion of nodes (pdel) as a function of the probable number ofconnections (k).