Download
1 / 60
600 likes | 757 Views
Multiple Measures of Teacher Effectiveness Laura Goe, Ph.D. Tennessee Department of Education Nashville, TN 10/12/2010. Laura Goe, Ph.D. Former teacher in rural & urban schools Special education (7 th & 8 th grade, Tunica, MS) Language arts (7 th grade, Memphis, TN)

E N D
Multiple Measures of Teacher EffectivenessLaura Goe, Ph.D. Tennessee Department of Education Nashville, TN 10/12/2010
Laura Goe, Ph.D. Former teacher in rural & urban schools Special education (7th & 8th grade, Tunica, MS) Language arts (7th grade, Memphis, TN) Graduate of UC Berkeley’s Policy, Organizations, Measurement & Evaluation doctoral program Principal Investigator for the National Comprehensive Center for Teacher Quality Research Scientist in the Learning & Teaching Research Center at ETS 2
Part 1: An Overview of Teacher Quality, Teacher Effectiveness, and Teacher Evaluation
What the evidence says about teacher quality (Goe, 2007) • Experience matters, but only for the first five years or so as teachers learn on the job; After that, experience adds little in terms of student achievement • Teachers’ subject matter knowledge (as evidenced by course-taking) appears to contribute significantly to math achievement, particularly at the secondary level, but research has not convincingly demonstrated that it matters in other subjects • Subject matter certification contributes significantly to math achievement, but is not significantly and consistently related to student achievement in other subjects
Research Behind the Push for New Evaluation Measures and Systems • The Widget Effect report (Weisberg et al., 2009) “…examines our pervasive and longstanding failure to recognize and respond to variations in the effectiveness of our teachers.” (from Executive Summary) • Value-added research shows that teachers vary greatly in their contributions to student achievement (Rivkin, Hanushek, & Kain, 2005).
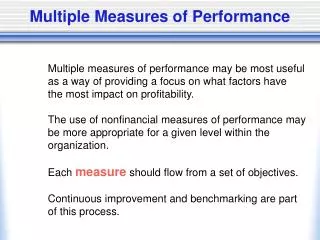
Keys to Measuring teacher Effectiveness • Measure what is required (i.e., federal/state legislation and incentives) • Measure what is valued (i.e., all the things we expect teachers to do) • Develop and make available to teachers and evaluators the standards by which teachers will be evaluated • Familiarize teachers with tools and processes of the evaluation • Measure performance against the standards
Race to the Top definition of effective & highly effective teacher Effective teacher: students achieve acceptable rates (e.g., at least one grade level in an academic year) of student growth (as defined in this notice). States, LEAs, or schools must include multiple measures, provided that teacher effectiveness is evaluated, in significant part, by student growth (as defined in this notice). Supplemental measures may include, for example, multiple observation-based assessments of teacher performance. (pg 7) Highly effective teacher students achieve high rates (e.g., one and one-half grade levels in an academic year) of student growth (as defined in this notice). 8
Race to the Top definition of student achievement Student achievement means— (a) For tested grades and subjects: (1) a student’s score on the State’s assessments under the ESEA; and, as appropriate, (2) other measures of student learning, such as those described in paragraph (b) of this definition, provided they are rigorous and comparable across classrooms. (b) For non-tested grades and subjects: alternative measures of student learning and performance such as student scores on pre-tests and end-of-course tests; student performance on English language proficiency assessments; and other measures of student achievement that are rigorous and comparable across classrooms. 9
Race to the Top definition of student growth • Student growth means the change in student achievement (as defined in this notice) for an individual student between two or more points in time. A State may also include other measures that are rigorous and comparable across classrooms. (pg 11) 10
Achievement Proficient Teacher A: “Success” on Ach. Levels Teacher B: “Failure” on Ach. Levels Start of School Year End of Year Teacher contributions to GROWTH in learning (1) In terms of learning growth, Teachers A and B areperforming equally Slide courtesy of Doug Harris, Ph.D, University of Wisconsin-Madison
Achievement Proficient High Ach. Level, Low Growth Low Ach. Level, High Growth Start of School Year End of Year Teacher contributions to GROWTH in learning (1) A teacher with low-proficiency students can still be high in terms of contributing to growth Slide courtesy of Doug Harris, Ph.D, University of Wisconsin-Madison
What standardized tests can’t tell you • Standardized tests can’t tell you why students in a particular classroom are scoring high • Maybe there is a narrow instructional focus on test content • Or maybe the classroom offers a rich, engaging curriculum that fosters deep student learning • How teachers are getting results matters, not just the results themselves
Measures of teacher effectiveness • Evidence of growth in student learning and competency • Standardized tests, pre/post tests in untested subjects • Student performance (art, music, etc.) • Curriculum-based tests given in a standardized manner • Classroom-based tests such as DIBELS • Evidence of instructional quality • Classroom observations • Lesson plans, assignments, and student work • Other evidence (varies, based on local values) • Administrator/supervisor reports • Surveys of students and/or parents • An “evidence binder” created & presented by the teacher
Evidence binders • Teachers collect and organize evidence that demonstrates their proficiency and/or indicates progress in • Classroom practice • Professional/out-of-class activities • Student learning linked to teacher practice • Teacher assignment + student work • Teacher assignment + set of student work showing growth • Pre- and post-test scores showing student progress • DIBELS and other classroom-based tests
Growth opportunities for all teachers Duke, DL; Stiggins, RJ. (1986.) Teacher Evaluation: Five Keys to Growth. West Haven, CT: National Education Association. ERIC # ED275069 (full text, pg 15)
Growth-oriented evaluation • Many evaluation systems currently in use ignore growth opportunities for teachers who are “doing fine” • For teachers who are struggling, the “help” may be seen as punitive rather than as creating opportunities for teachers to improve practice • But some measures of teacher performance are far more useful than others in helping teachers to improve their practice, which will in turn improve student learning
Measures that help teachers grow • Measures that motivate teachers to examine their own practice against specific standards • Measures that allow teachers to participate in or co-construct the evaluation (such as “evidence binders”) • Measures that give teachers opportunities to discuss the results with evaluators, administrators, colleagues, teacher learning communities, mentors, coaches, etc. • Measures that are directly and explicitly aligned with teaching standards • Measures that are aligned with professional development offerings • Measures which include protocols and processes that teachers can examine and comprehend 18
Part 2: Models of Comprehensive Teacher Evaluation Systems that Include Student Growth for All Teachers
Austin Independent School District Student Learning Objectives: • Teachers determine two SLOs for the semester/year • One SLO must address all students, other may be targeted • Use broad array of assessments • Assess student needs more directly • Align classroom, campus, and district expectations • Aligned to state standards/campus improvement plans • Based on multiple sources of student data • Assessed with pre and post assessment • Targets of student growth • Peer collaboration
SLO Model Strengths/Weaknesses • Strengths • Teachers take an active role in determining student learning goals • Good professional growth opportunity for teachers • If objectives are of high-quality and teachers plan instruction to meet them, students should benefit • Weaknesses • Heavily dependent on administrator understanding and time commitment to supervision • Not clear how or if “rigor” could be determined • Not “comparable across classrooms” because teachers set the objectives and they will vary widely • Not clear how students’ beginning point is determined
“Rhode Island Model” is another example of an SLO Model • Under consideration, not yet implemented • Teachers measure student growth by setting student academic goals aligned to standards • Principals, during the goal setting process, will confer with teachers to establish each goal’s degree of ambition and select the appropriate assessments for measuring progress against the goals • Teacher evaluation will be based on students’ progress on the established goals, as determined by an end-of-the-year principal review of the pre-determined assessments and their results
The “Rhode Island Model” • The Rhode Island Model (RI Model) • Impact on student learning • Professional Practice (including content knowledge) • Professional Responsibilities • “…each teacher’s Student Learning (SL) rating will be determined by a combination of state-wide standardized tests, district-selected standardized tests, and local school-based measures of student learning whenever possible.”
RIDE Model: Impact on Student Learning • Category 1: Student growth on state standardized tests that are developed and/or scored by RIDE • Category 2: Student performance (as measured by growth) on standardized district-wide tests that are developed and/or scored by either the district or by an external party but not by RIDE (e.g., NWEA, AP exams, Stanford-10, ACCESS, etc.) • Category 3: Other, more subjective measures of student performance (growth measures and others, as appropriate) that would likely be developed and/or scored at the district- or school-level (e.g., student performance on school- or teacher-selected assessments, administrator review of student work, attainment of student learning goals that are developed and approved by both teacher and evaluator, etc.)
Rhode Island DOE Model: Framework for Applying Multiple Measures of Student Learning Student learning rating The student learning rating is determined by a combination of different sources of evidence of student learning. These sources fall into three categories: + Professional practice rating Category 1: Student growth on state standardized tests (e.g., NECAP, PARCC) Category 2: Student growth on standardized district-wide tests (e.g., NWEA, AP exams, Stanford-10, ACCESS, etc.) Category 3: Other local school-, administrator-, or teacher-selected measures of student performance + Professional responsibilities rating Final evaluation rating
“‘Rhode Island Model”: Student Learning Group Guiding Principles • “Not all teachers’ impact on student learning will be measured by the same mix of assessments, and the mix of assessments used for any given teacher group may vary from year to year.” • Teacher A (5th grade) • Teacher B (11th grade English) • Teacher C (middle school art) • This teacher may use several category 3 assessments Category 3 (e.g., principal review of student work over a six month span) Teacher A’s student learning rating Category 1 (growth on NECAP) Category 2 (e.g., growth on NWEA) Category 3 (e.g., joint review of critical essay portfolio) Teacher B’s student learning rating + = + Category 2 (e.g., AP English exam) + =
“Rhode Island Model” Strengths and Weaknesses • Strengths • Includes teachers in evaluation of student learning (outside of standardized tests) • Teachers will benefit from having assessment of student learning at the classroom level • Weaknesses • Heavily administrator/evaluator driven process • Teachers can weigh in on assessments, but do not determine student growth
Teacher Advancement Program (TAP) Model • TAP requires that teachers in tested subjects be evaluated with value-added models • All teachers are observed in their classrooms (using a Charlotte Danielson type instrument) at least three times per year by different observers (usually one administrator and two teachers who have been appointed to the role) • Teacher effectiveness (for performance awards) determined by combination of value-added and observations • Teachers in non-tested subjects are given the school-wide average for their value-added component, which is combined with their observation scores
TAP strengths/weaknesses • Strengths • Value-added becomes everyone’s responsibility, which should encourage efforts from teachers in non-tested subjects to support teachers in tested subjects • Multiple yearly observations should be more informative and produce more reliable information about practice • Professional development aligned with results is required • Weaknesses • Concerns about “fairness” when only a few teachers’ student achievement and progress toward learning goals “counts” • Tells you nothing about how teachers in other subjects are performing in terms of student learning growth (grades are not always good indicators)
IMPACT sorts teachers into groups that are evaluated differently • Group 1: general ed teachers for whom value-added data can be generated • Group 2: general ed teachers for whom value-added data cannot be generated • Group 3: special education teachers • Group 4: non-itinerant English Language Learner (ELL) teachers and bilingual teachers • Group 5: itinerant ELL teachers • Etc…
IMPACT components for Group 1 • Individual Value-Added (IVA) = 50% of score • Teaching and Learning Framework (TLF) (measure of instructional expertise) = 40% of score • Commitment to the School Community (CSC) (measure of the extent to which you support your colleagues and your school’s local initiatives) = 5% of score
IMPACT components for Group 2 • Teaching and Learning Framework (TLF) (measure of instructional expertise) = 80% of score • Non-Value-Added Student Achievement Growth (NVA) = 10% • Commitment to the School Community (CSC) (measure of the extent to which you support your colleagues and your school’s local initiatives) = 5% • School-wide value-added = 5%
Explanation for 10% for test scores for Group 2 and others • “As a school system, we recognize that we still have a significant amount of work to do to establish norms for student achievement growth outside of the DC CAS grades and subjects. In recognition of this fact, we have decided to limit this component to just 10% of the overall assessment. As we develop clearer norms, we plan to increase this percentage.”
Group 2 assessment rubric • 3 “cycles” of data collected & averaged/year • Highest level of rubric: • “Teacher has at least 1 high-quality source of evidence (i.e., one that is rigorous and reliable) demonstrating that approximately 90% or more of her/his students are on track to make significant learning growth (i.e., at least a year’s worth) towards mastery of the DCPS content standards over the course of the year.”
Non-VAM tests (accepted under Washington, DC’s IMPACT evaluation system) • DC Benchmark Assessment System (DC BAS) • Dynamic Indicators of Basic Early Literacy Skills (DIBELS) • Developmental Reading Assessment (DRA) • Curriculum-based assessments (e.g., Everyday Mathematics) • Unit tests from DCPS-approved textbooks • Off-the-shelf standardized assessments that are aligned to the DCPS Content Standards • Rigorous teacher-created assessments that are aligned to the DCPS Content Standards • Rigorous portfolios of student work that are aligned to the DCPS Content Standards 38
DC IMPACT Strengths & Weaknesses • Strengths • Uses multiples measures to assess effectiveness • Permits the use of many types of assessment for students in non-tested subjects and grades • Includes what is important in the system (in order to encourage specific teacher behaviors) • Weaknesses • No multiple measures of student learning growth for teachers in tested subjects and grades • Huge differences in how teachers are measured
Georgia KEYS Strengths & Weaknesses • Strengths • Rubric for measuring teacher contribution is easy to understand • Includes examples of multiple measures of student learning for all teachers, including those in tested grades and subjects • Weaknesses • Rubric (including observation and other information) is about 100 pages long • Might be a challenge to implement
Delaware Model • Standardized test will be used as part of teachers’ scores in some grades/subjects • “Group alike” teachers, meeting with facilitators, determine which assessments, rubrics, processes can be used in their subjects/grades (multiple measures) • Assessments must focus on standards, be given in a “standardized” way, i.e., giving pre-test on same day, for same length of time, with same preparation • Teachers recommend assessments to the state for approval • Teachers/groups of teachers take primary responsibility for determining student growth • State will monitor how assessments are “working”
Delaware Model: Strengths & Weaknesses • Strengths • Teacher-driven process (assumes teachers are the experts in assessing their students’ learning growth) • Great professional growth opportunity as teachers work together across schools to determine assessments, score student work, etc. • Weaknesses • Validity issues (how the assessments are given and scored, teacher training to score, etc.) • Time must be built in for teachers to work together on scoring (particularly for rubric-based assessments)
Questions to ask about models • Are they “rigorous and comparable across classrooms”? • Do they show student learning growth “between two points in time”? • Are they based on grade level and subject standards? • Do they allow teachers from all subjects to be evaluated with evidence of student learning growth?
Part 3: Measuring Teachers’ Contributions to Student Achievement Growth in Non-Tested Subjects and Grades
Evidence of growth in student learning • Evidence is strongest when it is • Standardized, meaning that all teachers used the assessment in exactly the same way • Gave the assessment on the same day • Gave students a specific amount of time to complete the test • Used the same preparation/instructions prior to the test • Recorded/reported results accurately • Valid, meaning that it measures what is intended • Items (questions) accurately capture students’ understanding and knowledge • Progress towards proficiency in a subject is captured because there are sufficient items to measure students at all levels • Recorded, meaning that student progress can be compared across classrooms and schools 48
Standardization is key • Standardizing how curriculum- or classroom-based tests are given is key to ensuring that tests are “rigorous and comparable across classrooms” • Ensure that tests meet district approval • For subject-matter tests, ensure that • Tests are given on the same day, at the same time, for the same length of time, with supervision • Teachers agree to appropriate “test prep” rules
Challenges for Special Education Teachers and ELL Specialists • Challenges for SWD and ELLs • Small student numbers • Not all special educators and ELLs instruct students in tested subjects • Teacher contribution to social and behavioral growth would not be factored into results • Teachers working with students on alternate standards • Little research exploring whether growth rates are comparable • Little research on the use of accommodations & their impact related to teacher effects